Giotto Object Creation#
- Date:
2023-07-26
1. How to create a Giotto Object#
In this tutorial, the methodology and syntax to create a giotto
object is shown and osmFISH data is used throughout the tutorial.
1.1 Import Giotto and Download the Data#
To download this data, please ensure that wget is installed locally.
library(Giotto)

genv_exists = checkGiottoEnvironment()
if(!genv_exists){
  # The following command need only be run once to install the Giotto environment.
  installGiottoEnvironment()
}

# Specify path from which data may be retrieved/stored
data_directory = paste0(getwd(),'/gobject_data/')
# alternatively, "/path/to/where/the/data/lives/"

# Specify path to which results may be saved
results_directory = paste0(getwd(),'/gobject_results/')
# alternatively, "/path/to/store/the/results/"

# Download osmFISH dataset to data_directory
getSpatialDataset(dataset = 'osmfish_SS_cortex', directory = data_directory, method = 'wget')
1.2 Minimum requirements for a Giotto Object#
Expression matrix
Spatial locations (unnecessary for scRNAseq analysis)
Here, creating a giotto object with the minimum requirements is
shown in two examples. Data formatting guidelines are shown below this
code block.
# Example 1.
# Create a Giotto object using data directly from file paths
osm_exprs = paste0(data_directory, "osmFISH_prep_expression.txt")
osm_locs = paste0(data_directory, "osmFISH_prep_cell_coordinates.txt")

minimum_gobject1 = createGiottoObject(expression = osm_exprs,
                                      spatial_locs = osm_locs)

# Example 2.
# Create a Giotto object using objects already loaded into workspace
expression_matrix = readExprMatrix(path = osm_exprs) # fast method to read expression matrix
cell_locations = data.table::fread(file = osm_locs)

minimum_gobject2 = createGiottoObject(expression = expression_matrix,
                                      spatial_locs = cell_locations)
Expression file formatting
feat_ID |
Cell_1 |
Cell_2 |
Cell_3 |
… |
|
|---|---|---|---|---|---|
1 |
Gene1 |
||||
2 |
Gene2 |
||||
3 |
Gene3 |
||||
… |
matrix and DelayedMatrix objects should have feature IDs already incorporated as the rownames.
Cell_1 |
Cell_2 |
Cell_3 |
… |
|
|---|---|---|---|---|
Gene1 |
||||
Gene2 |
||||
Gene3 |
||||
… |
Locations file formatting
Numerical columns will be interpreted in order of x, y, and (optionally) z coordinate. The first non-numerical column will be taken as cell IDs
sdimx |
sdimy |
sdimz |
cell_ID |
|
|---|---|---|---|---|
1 |
||||
2 |
||||
3 |
||||
*Note: multiple expression files during can be given at once during Giotto object creation by using a named list.
# Arbitrary modifications
scaled_matrix = expression_matrix * 1.2
custom_matrix = expression_matrix * 0.5

# Provide multiple expression matrices at once to the Giotto Object
# If these matrices are stored in files rather than in the workspace,
# file paths may be provided instead of variables
multi_expr_gobject = createGiottoObject(expression = list(raw = expression_matrix,
                                                          scaled = scaled_matrix,
                                                          custom = custom_matrix),
                                        spatial_locs = cell_locations)
1.3 Customizing the Giotto Object#
By providing values to other createGiottoObject() parameters, it is
possible to add:
Cell or feature (gene) metadata: see addCellMetadata and addFeatMetadata
Spatial networks or grids: see Visualizations
Dimension reduction: see Clustering
Images: see Imaging
giottoInstructions: see createGiottoInstructions and below
Providing giottoInstructions allows the specification of:
An alternative python path if using the Giotto Environment (default) is not desired
A directory to which resulting plots will save
Plot formatting
createGiottoInstruction() is used to create the instructions that
are provided to createGiottoObject(). The instructions()
function can then be used to view, set, or modify one or more of these
instructions after they have been added to a giotto object.
Here is an example of a more customized Giotto object.
# Specify data with file paths
osm_exprs = paste0(data_directory, "osmFISH_prep_expression.txt")
osm_locs = paste0(data_directory, "osmFISH_prep_cell_coordinates.txt")
meta_path = paste0(data_directory, "osmFISH_prep_cell_metadata.txt")

# Create instructions

# Optional: Specify a path to a Python executable within a conda or miniconda
# environment. If set to NULL (default), the Python executable within the previously
# installed Giotto environment will be used.
my_python_path = NULL # alternatively, "/local/python/path/python" if desired.

instrs = createGiottoInstructions(python_path = my_python_path,
                                  save_dir = results_directory,
                                  plot_format = 'png',
                                  dpi = 200,
                                  height = 9,
                                  width = 9)

# Create Giotto object
custom_gobject = createGiottoObject(expression = osm_exprs,
                                    spatial_locs = osm_locs,
                                    instructions = instrs)

# Add field annotations as cell metadata
metadata = data.table::fread(file = meta_path)
custom_gobject = addCellMetadata(custom_gobject, new_metadata = metadata,
                                 by_column = T, column_cell_ID = 'CellID')

# Show the Giotto instructions associated with the Giotto object
instructions(custom_gobject)
Note that although parameters show_plot, return_plot, and
save_plot were not specified within the call to
createGiottoInstructions(), default values were provided to these
instruction parameters. All instruction parameters have default values,
such that createGiottoInstructions() may be called with some or no
arguments yet all instruction parameters will have a value after its
execution.
Alternatively, a named list may also be provided to the instructions
argument of createGiottoObject(). However, ensure that all arguments
to
`createGiottoInstructions() <../docs/reference/createGiottoInstructions.html>`__
are defined when providing instructions as a named list, since default
values are only applied to instructions when made with
createGiottoInstructions(). Note that ``python_path`` must be
specified when providing instructions as a named list, and may not be
provided as NULL.
The giottoInstructions may be changed, or completely replaced:
# Change a specific previously set parameter, e.g. change dpi = 200 to dpi = 300
instructions(custom_gobject, 'dpi') = 300

# Observe that the instructions have changed
instructions(custom_gobject, 'dpi')

# Create new instructions using a named list
sub_results_directory = paste0(results_directory, 'specific_results/')
my_python_path = instructions(custom_gobject, 'python_path')
new_instrs = list(python_path = my_python_path,
                  show_plot = TRUE,
                  return_plot = FALSE,
                  save_plot = TRUE,
                  save_dir = sub_results_directory,
                  plot_format = 'jpg',
                  dpi = 250,
                  units = 'in',
                  height = 12,
                  width = 12,
                  is_docker = FALSE)

# Change all instructions
instructions(custom_gobject) = new_instrs

# Observe that the instructions have changed
instructions(custom_gobject)
1.3.1 Active spatial unit and feature type#
spat_unit and feat_type
parameters that govern which set of data to use. The active spatial
unit and feature type is visible when directly returning the
giotto object and decides what defaults are used when those
parameters are not supplied.giottoInstructions and there
are convenient accessors specific for those two settings:activeSpatUnit()activeFeatType()
1.4 Plotting Data from a Giotto Object#
Each plotting function in Giotto has three important binary parameters:
show_plot: print the plot to the console, default is TRUEreturn_plot: return the plot as an object, default is TRUEsave_plot: automatically save the plot, default is FALSE
These parameters are stored within a giotto object that was provided
instructions from createGiottoInstructions() and are provided to
plotting functions accordingly. To change these parameters from the
default values, the instructions may be changed or replaced, or these
parameters may be manually overwritten within plotting functions.
See
`showSaveParameters() <../docs/reference/showSaveParameters.html>`__
and the Saving Options tutorial for
alternative methods to save plots.
# Plot according to Giotto Instructions (default)
spatPlot(custom_gobject)
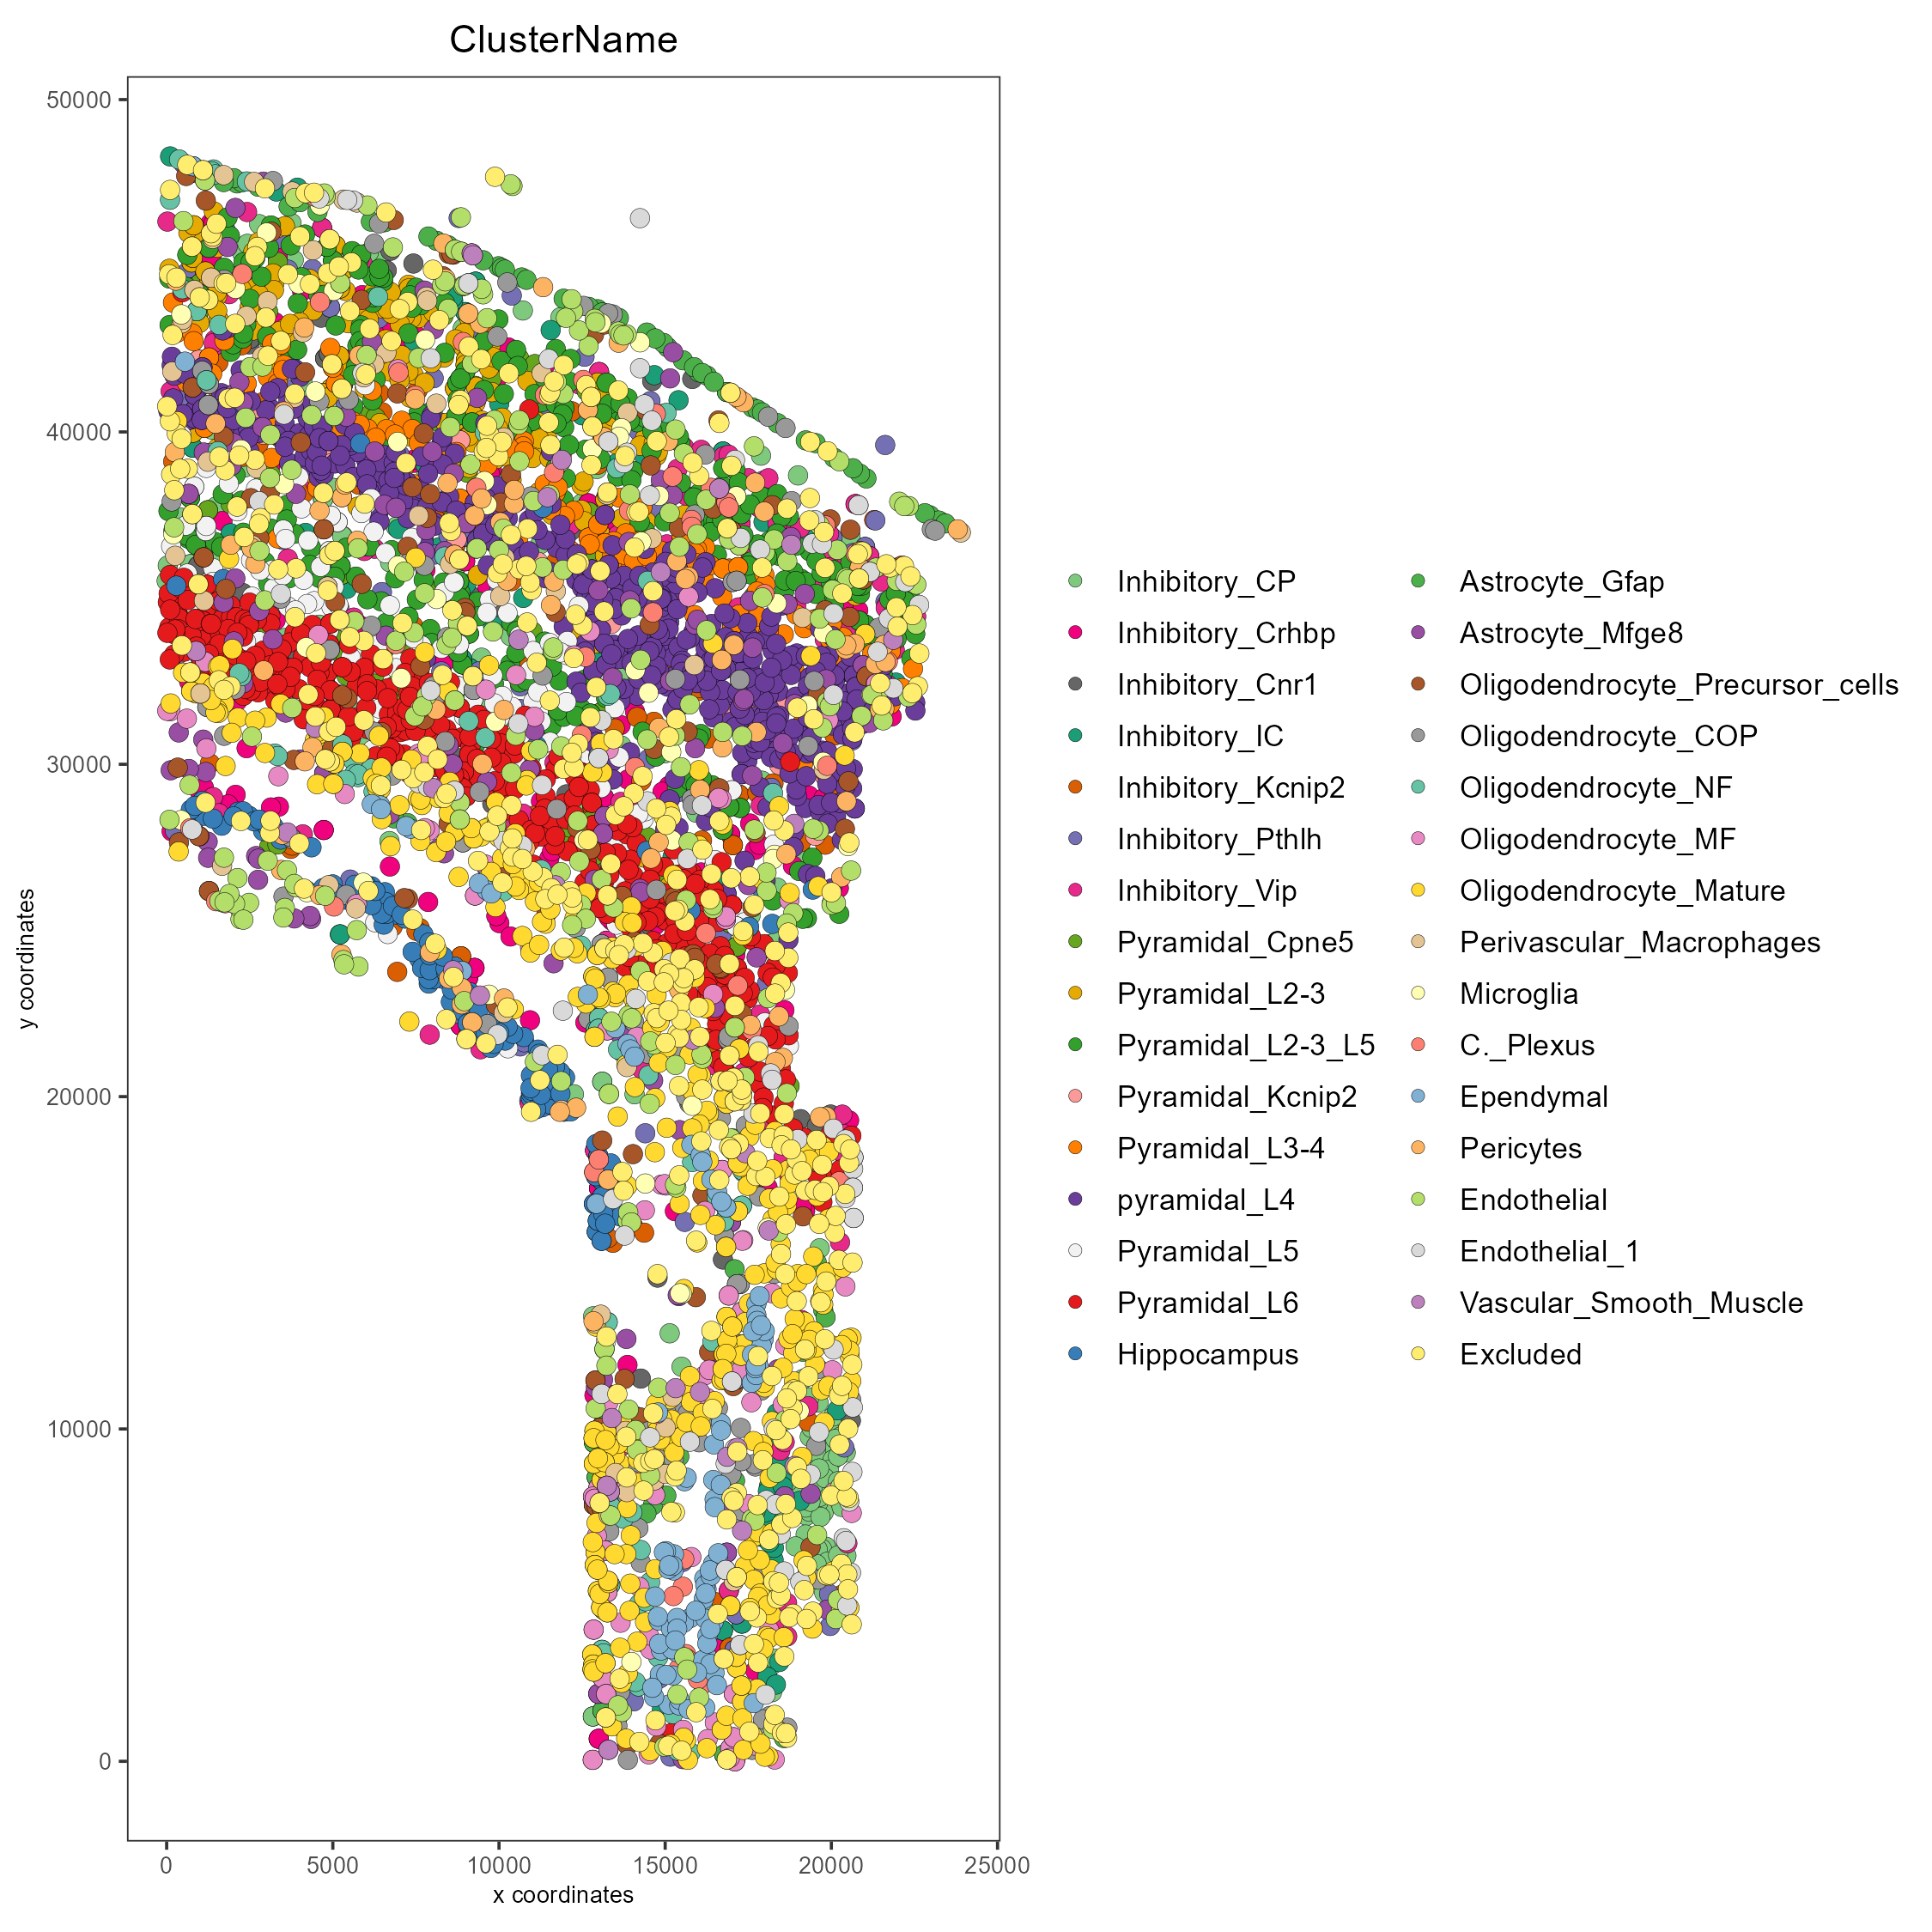
# Plot clusters, create, and save to a new subdirectory, all while overwriting formatting
spatPlot(custom_gobject,
cell_color = 'ClusterName',
save_plot = TRUE,
return_plot = TRUE,
show_plot = TRUE,
save_param = list(save_folder = 'plots/', # Create subdirectory
save_name = 'cell_clusters',
save_format = 'png',
units = 'in',
base_height = 9,
base_width = 9))
For a more in-depth look at the giotto object structure, take a look
at the introduction to giotto classes
2. Session Info#
sessionInfo()
R version 4.2.1 (2022-06-23)
Platform: x86_64-apple-darwin17.0 (64-bit)
Running under: macOS Big Sur ... 10.16

Matrix products: default
BLAS:   /Library/Frameworks/R.framework/Versions/4.2/Resources/lib/libRblas.0.dylib
LAPACK: /Library/Frameworks/R.framework/Versions/4.2/Resources/lib/libRlapack.dylib

locale:
[1] en_US.UTF-8/en_US.UTF-8/en_US.UTF-8/C/en_US.UTF-8/en_US.UTF-8

attached base packages:
[1] stats     graphics  grDevices utils     datasets  methods   base

loaded via a namespace (and not attached):
 [1] compiler_4.2.1  fastmap_1.1.1   cli_3.6.1       tools_4.2.1
 [5] htmltools_0.5.5 rstudioapi_0.14 yaml_2.3.7      rmarkdown_2.21
 [9] knitr_1.42      xfun_0.39       digest_0.6.31   jsonlite_1.8.4
[13] rlang_1.1.1     evaluate_0.21