merFISH Mouse Hypothalamus Preoptic Region
library(Giotto)
Install Python Modules
Warning
This tutorial was written with Giotto version 0.3.6.9046, your version is 1.0.3. This is a more recent version and results should be reproducible.
To run this vignette you need to install all of the necessary Python modules.
Important
Python module installation can be done either automatically via our installation tool (from within R) (see step 2.2A) or manually (see step 2.2B).
See Part 2.2 Giotto-Specific Python Packages of our Giotto Installation section for step-by-step instructions.
Dataset Explanation
Moffitt et al. created a 3D spatial expression dataset consisting of 155 genes from ~1 million single cells acquired over the mouse hypothalamic preoptic regions.
Dataset Download
The merFISH data to run this tutorial can be found here. Alternatively you can use the getSpatialDataset to automatically download this dataset like we do in this example.
# download data to working directory
# if wget is installed, set method = 'wget'
# if you run into authentication issues with wget, then add " extra = '--no-check-certificate' "
getSpatialDataset(dataset = 'merfish_preoptic', directory = my_working_dir, method = 'wget')
1. Giotto Global Instructions and Preparations
1.1 Optional: Set Giotto Instructions
# to automatically save figures in save_dir set save_plot to TRUE
temp_dir = getwd()
temp_dir = '~/Temp/'
myinstructions = createGiottoInstructions(save_dir = temp_dir,
                      save_plot = TRUE,
                      show_plot = FALSE)
1.2 Giotto Object
# 2. create giotto object from provided paths ####
expr_path = paste0(my_working_dir, "merFISH_3D_data_expression.txt.gz")
loc_path = paste0(my_working_dir, "merFISH_3D_data_cell_locations.txt")
meta_path = paste0(my_working_dir, "merFISH_3D_metadata.txt")
2. Create Giotto Object and Process The Data
## create Giotto object
merFISH_test <- createGiottoObject(raw_exprs = expr_path,
spatial_locs = loc_path,
instructions = instrs)
## add additional metadata if wanted
metadata = data.table::fread(meta_path)
merFISH_test = addCellMetadata(merFISH_test, new_metadata = metadata$layer_ID, vector_name = 'layer_ID')
merFISH_test = addCellMetadata(merFISH_test, new_metadata = metadata$orig_cell_types, vector_name = 'orig_cell_types')
## filter raw data
# 1. pre-test filter parameters
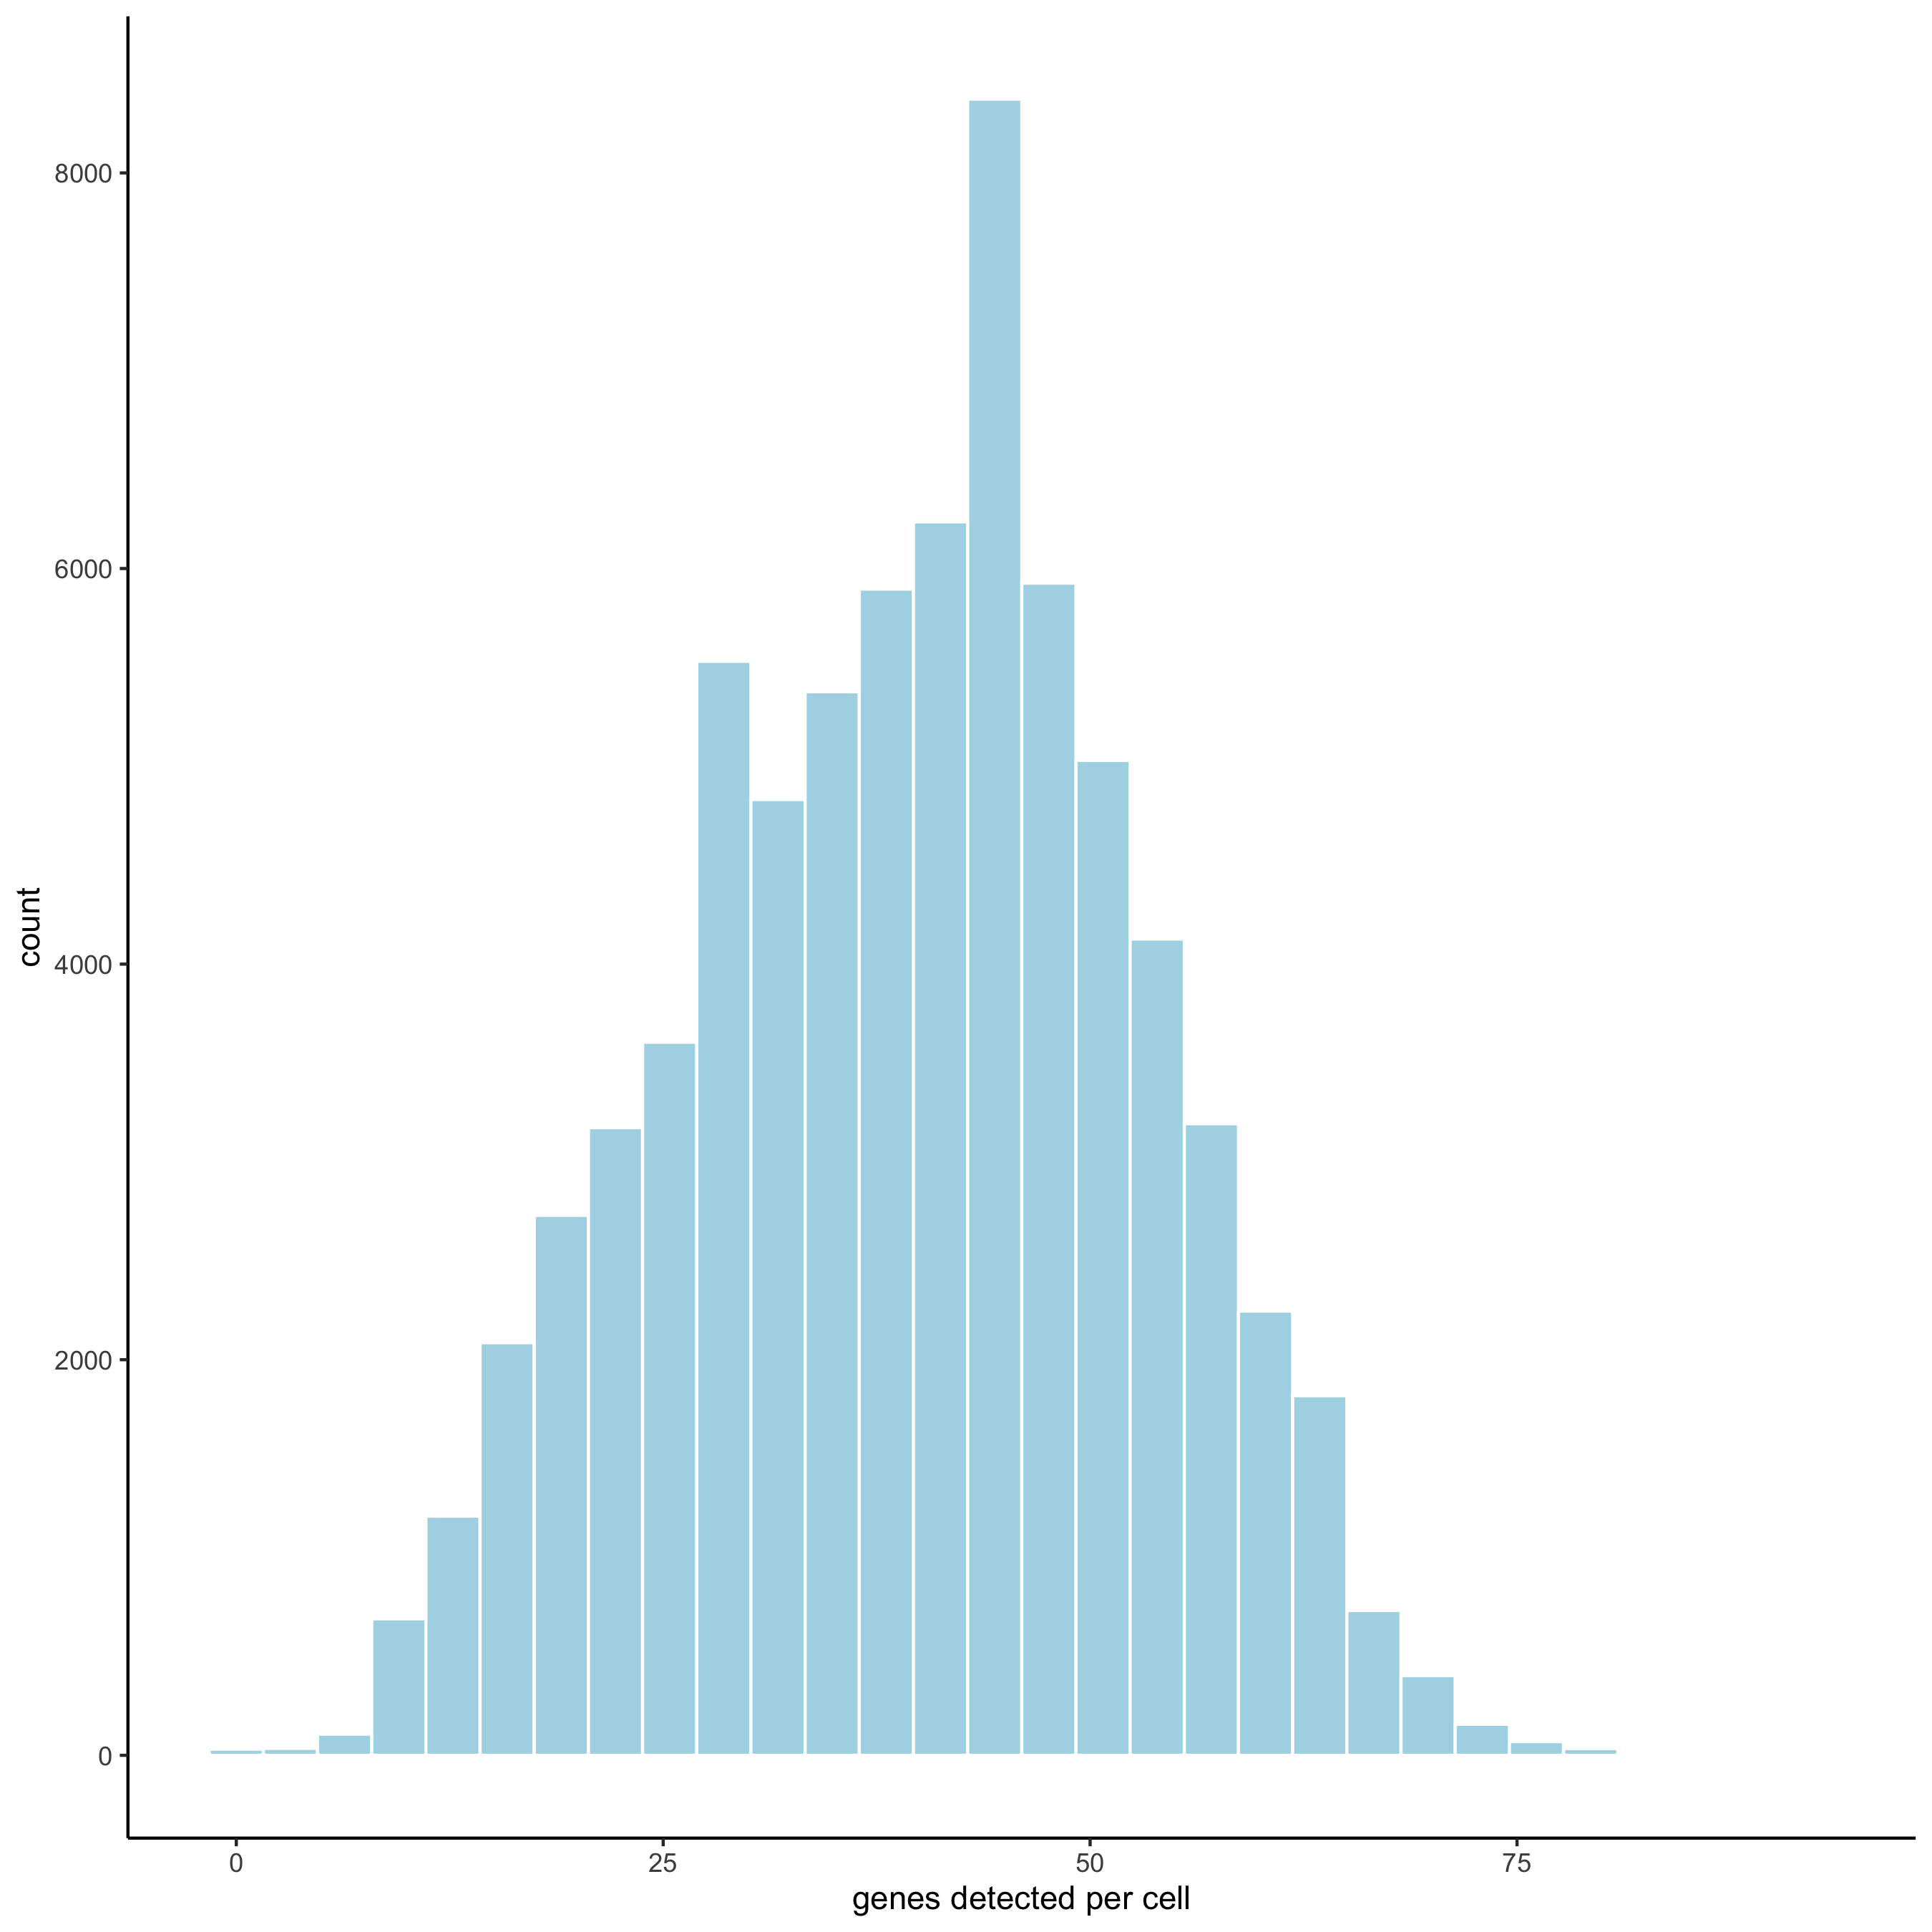
filterDistributions(merFISH_test, detection = 'genes',
save_param = list(save_name = '2_a_distribution_genes'))
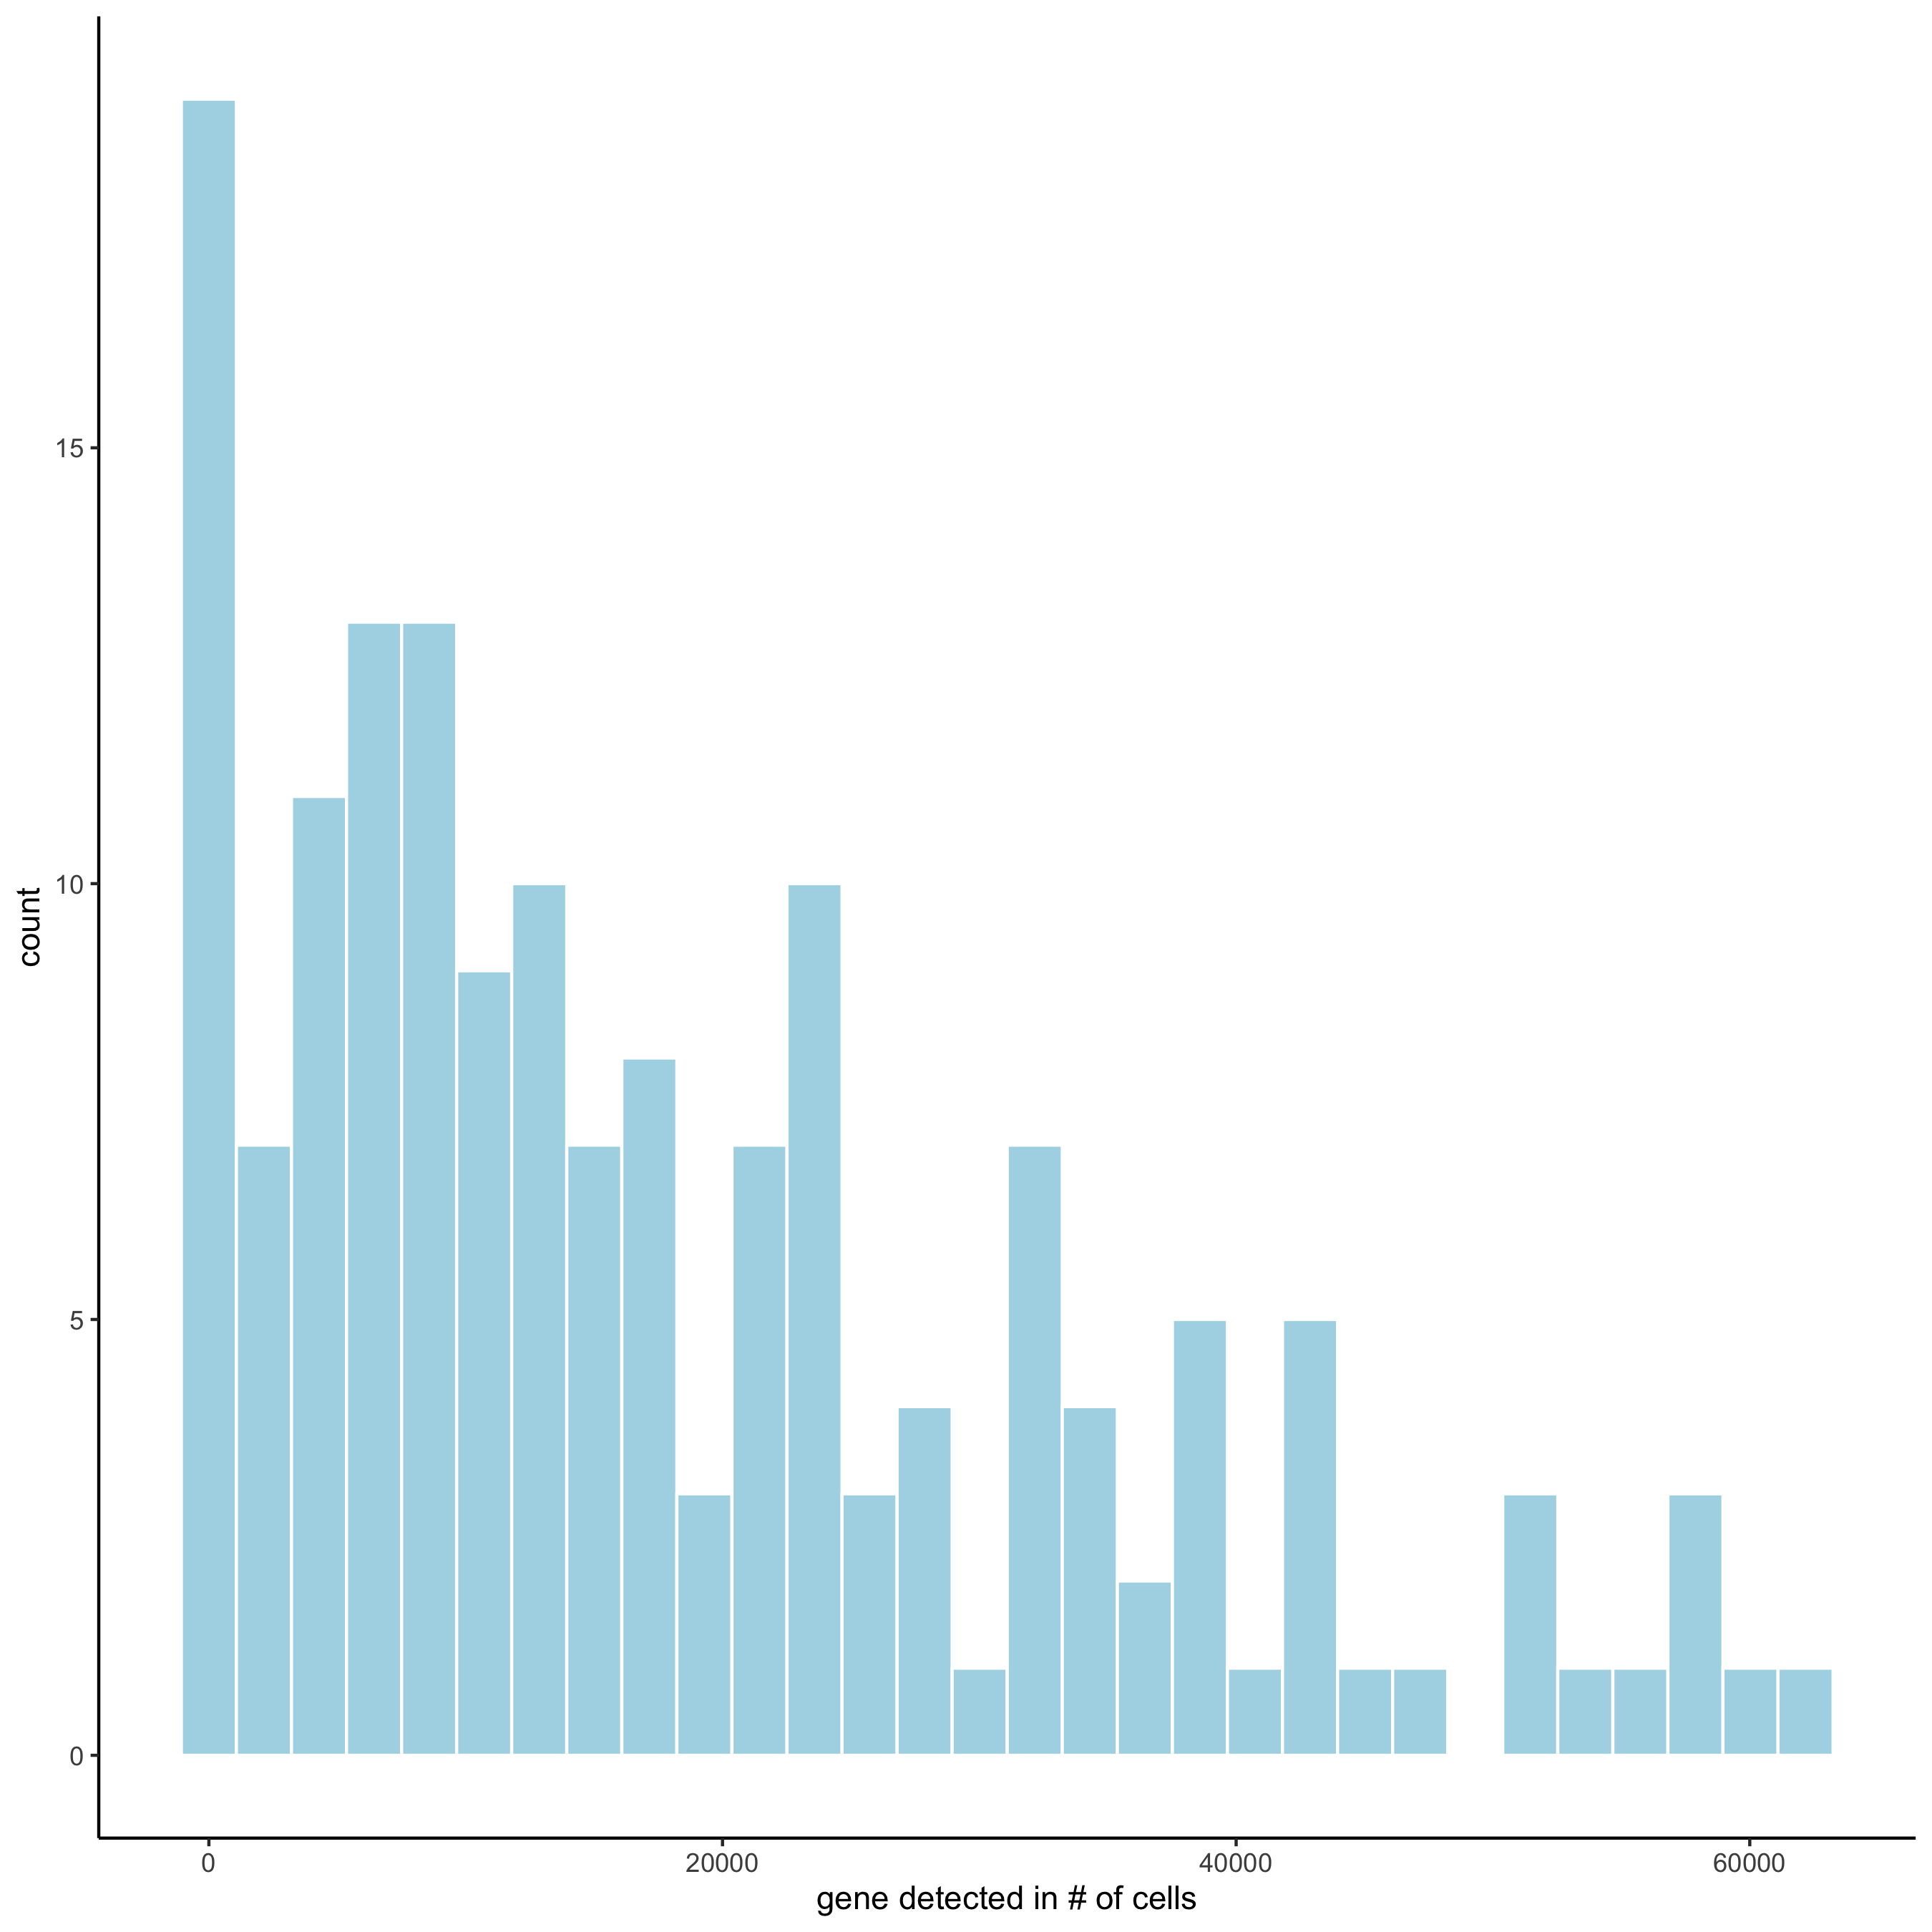
filterDistributions(merFISH_test, detection = 'cells',
        save_param = list(save_name = '2_b_distribution_cells'))
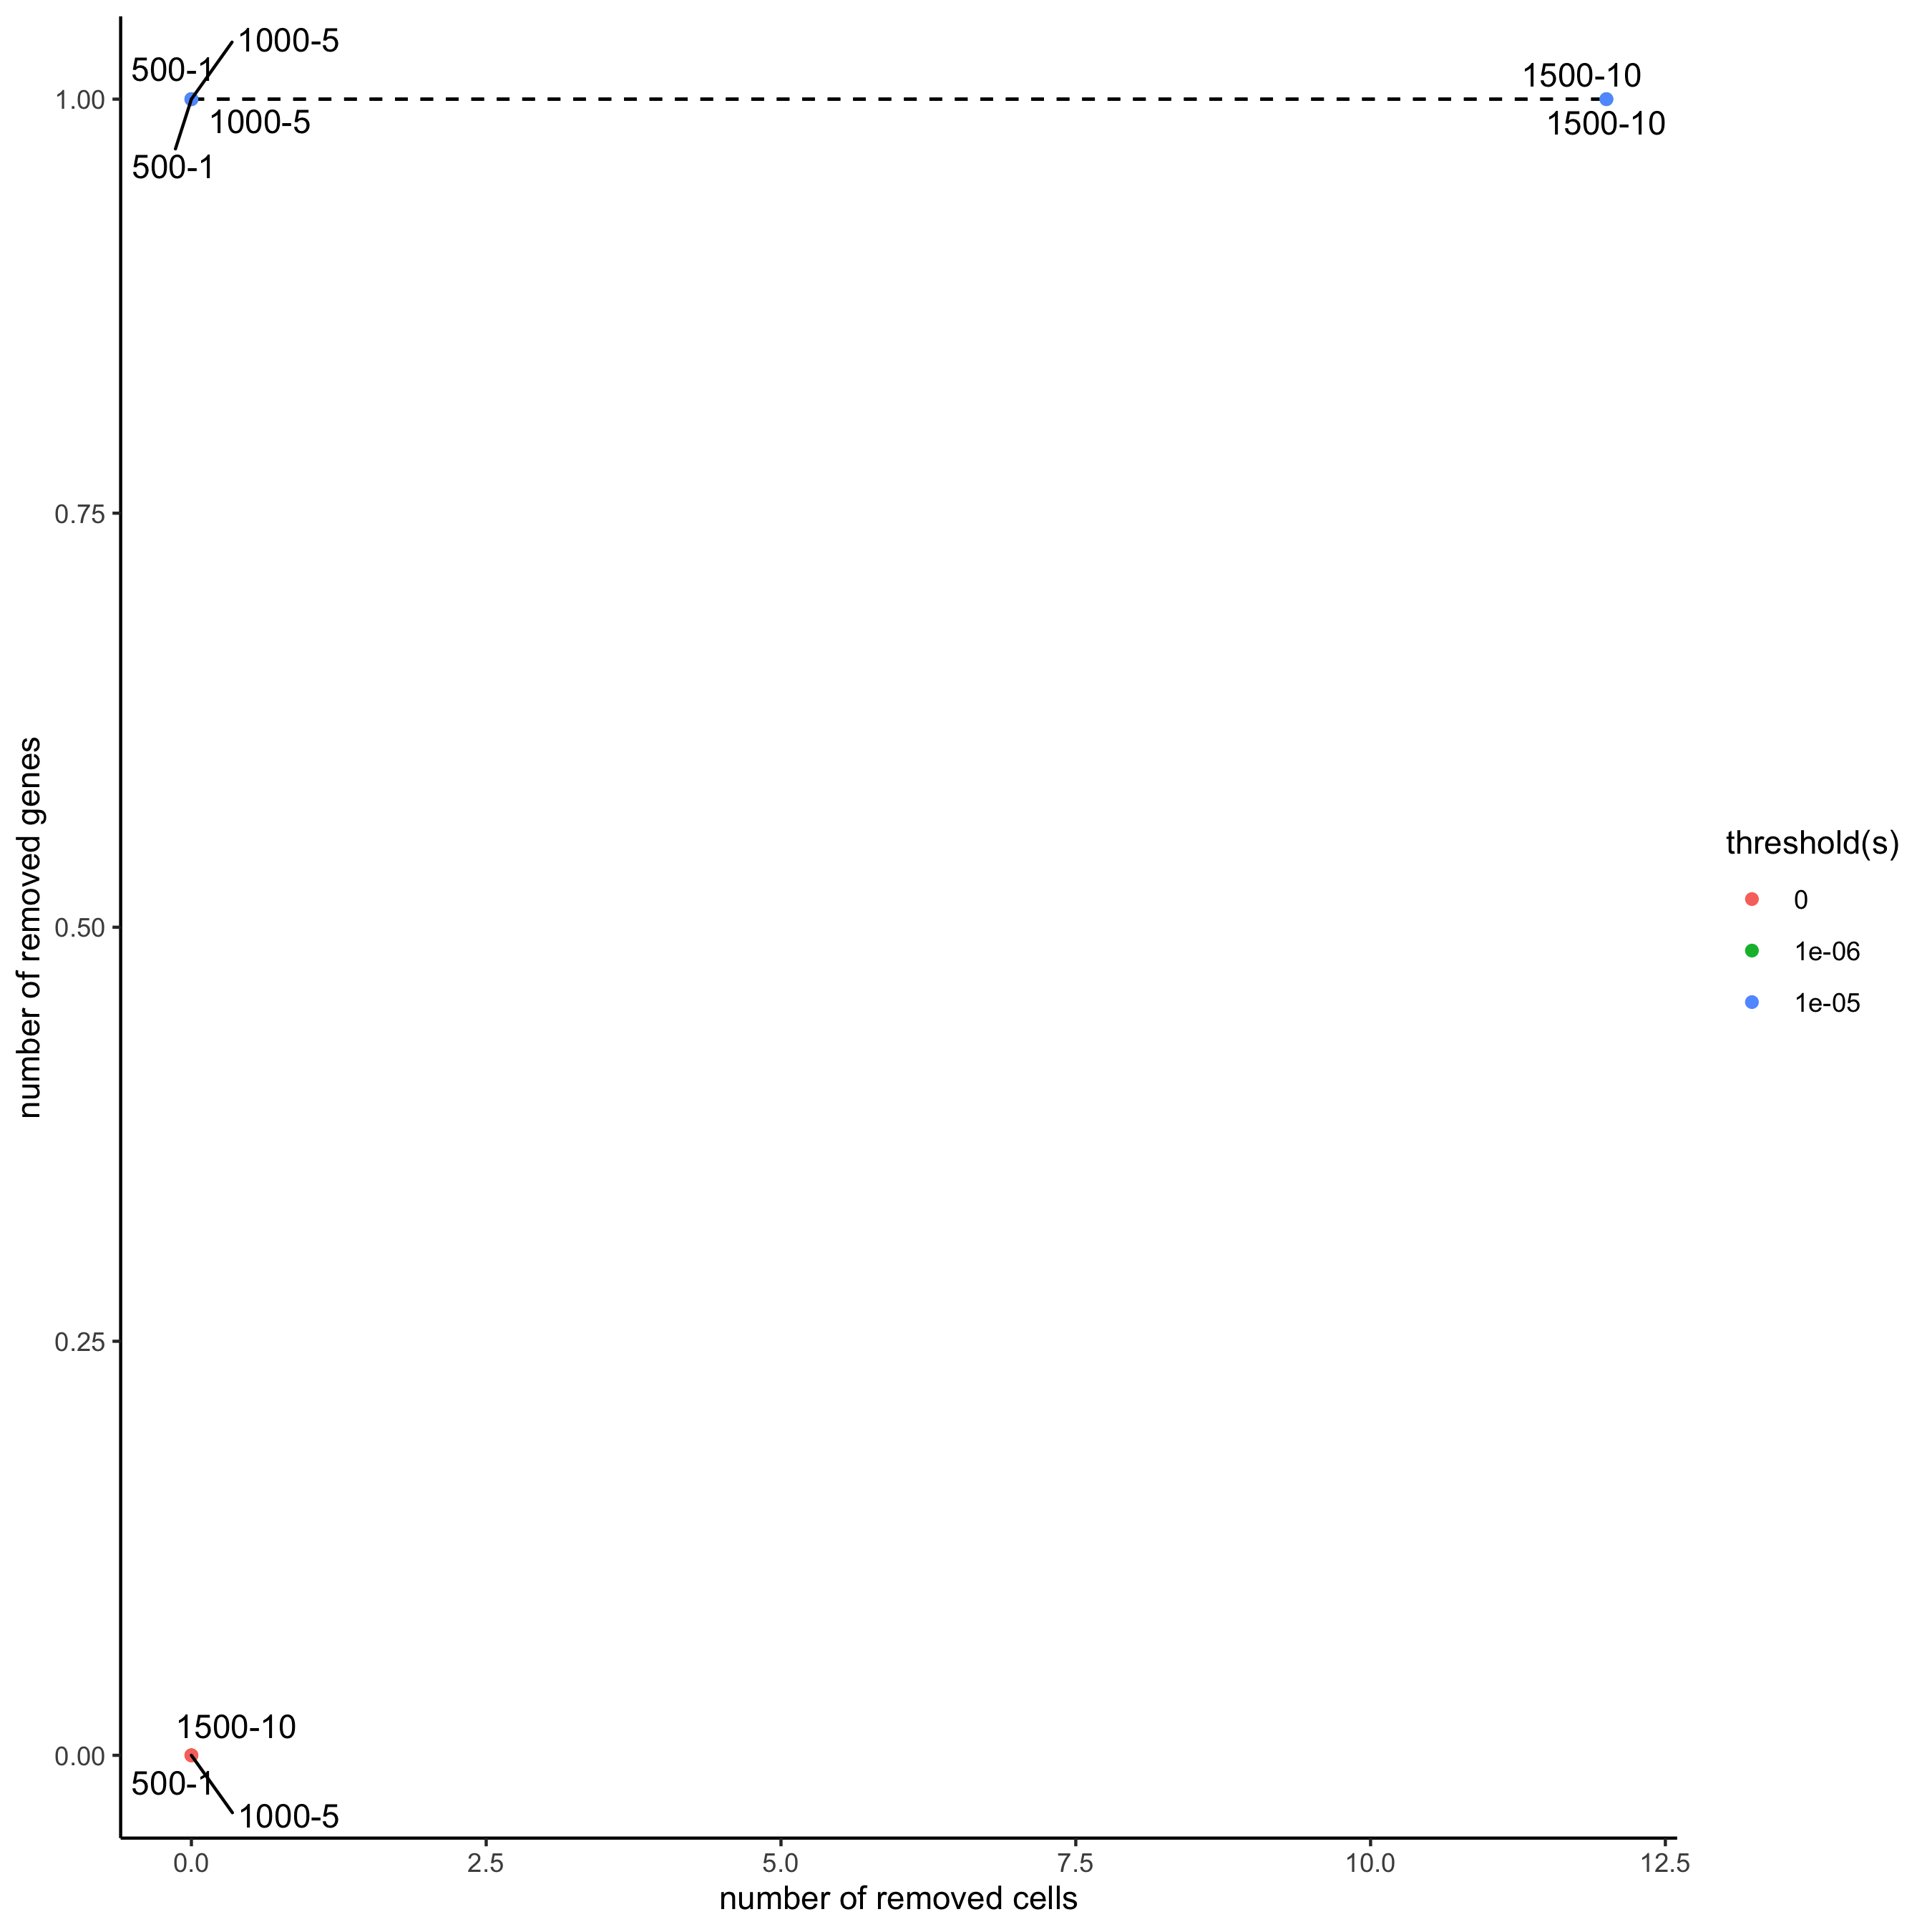
filterCombinations(merFISH_test,
       expression_thresholds = c(0,1e-6,1e-5),
       gene_det_in_min_cells = c(500, 1000, 1500),
       min_det_genes_per_cell = c(1, 5, 10),
       save_param = list(save_name = '2_c_filter_combos'))
# 2. filter data
merFISH_test <- filterGiotto(gobject = merFISH_test,
gene_det_in_min_cells = 0,
min_det_genes_per_cell = 0)
## normalize
merFISH_test <- normalizeGiotto(gobject = merFISH_test, scalefactor = 10000, verbose = T)
merFISH_test <- addStatistics(gobject = merFISH_test)
merFISH_test <- adjustGiottoMatrix(gobject = merFISH_test, expression_values = c('normalized'),
batch_columns = NULL, covariate_columns = c('nr_genes', 'total_expr'),
return_gobject = TRUE,
update_slot = c('custom'))
# save according to giotto instructions
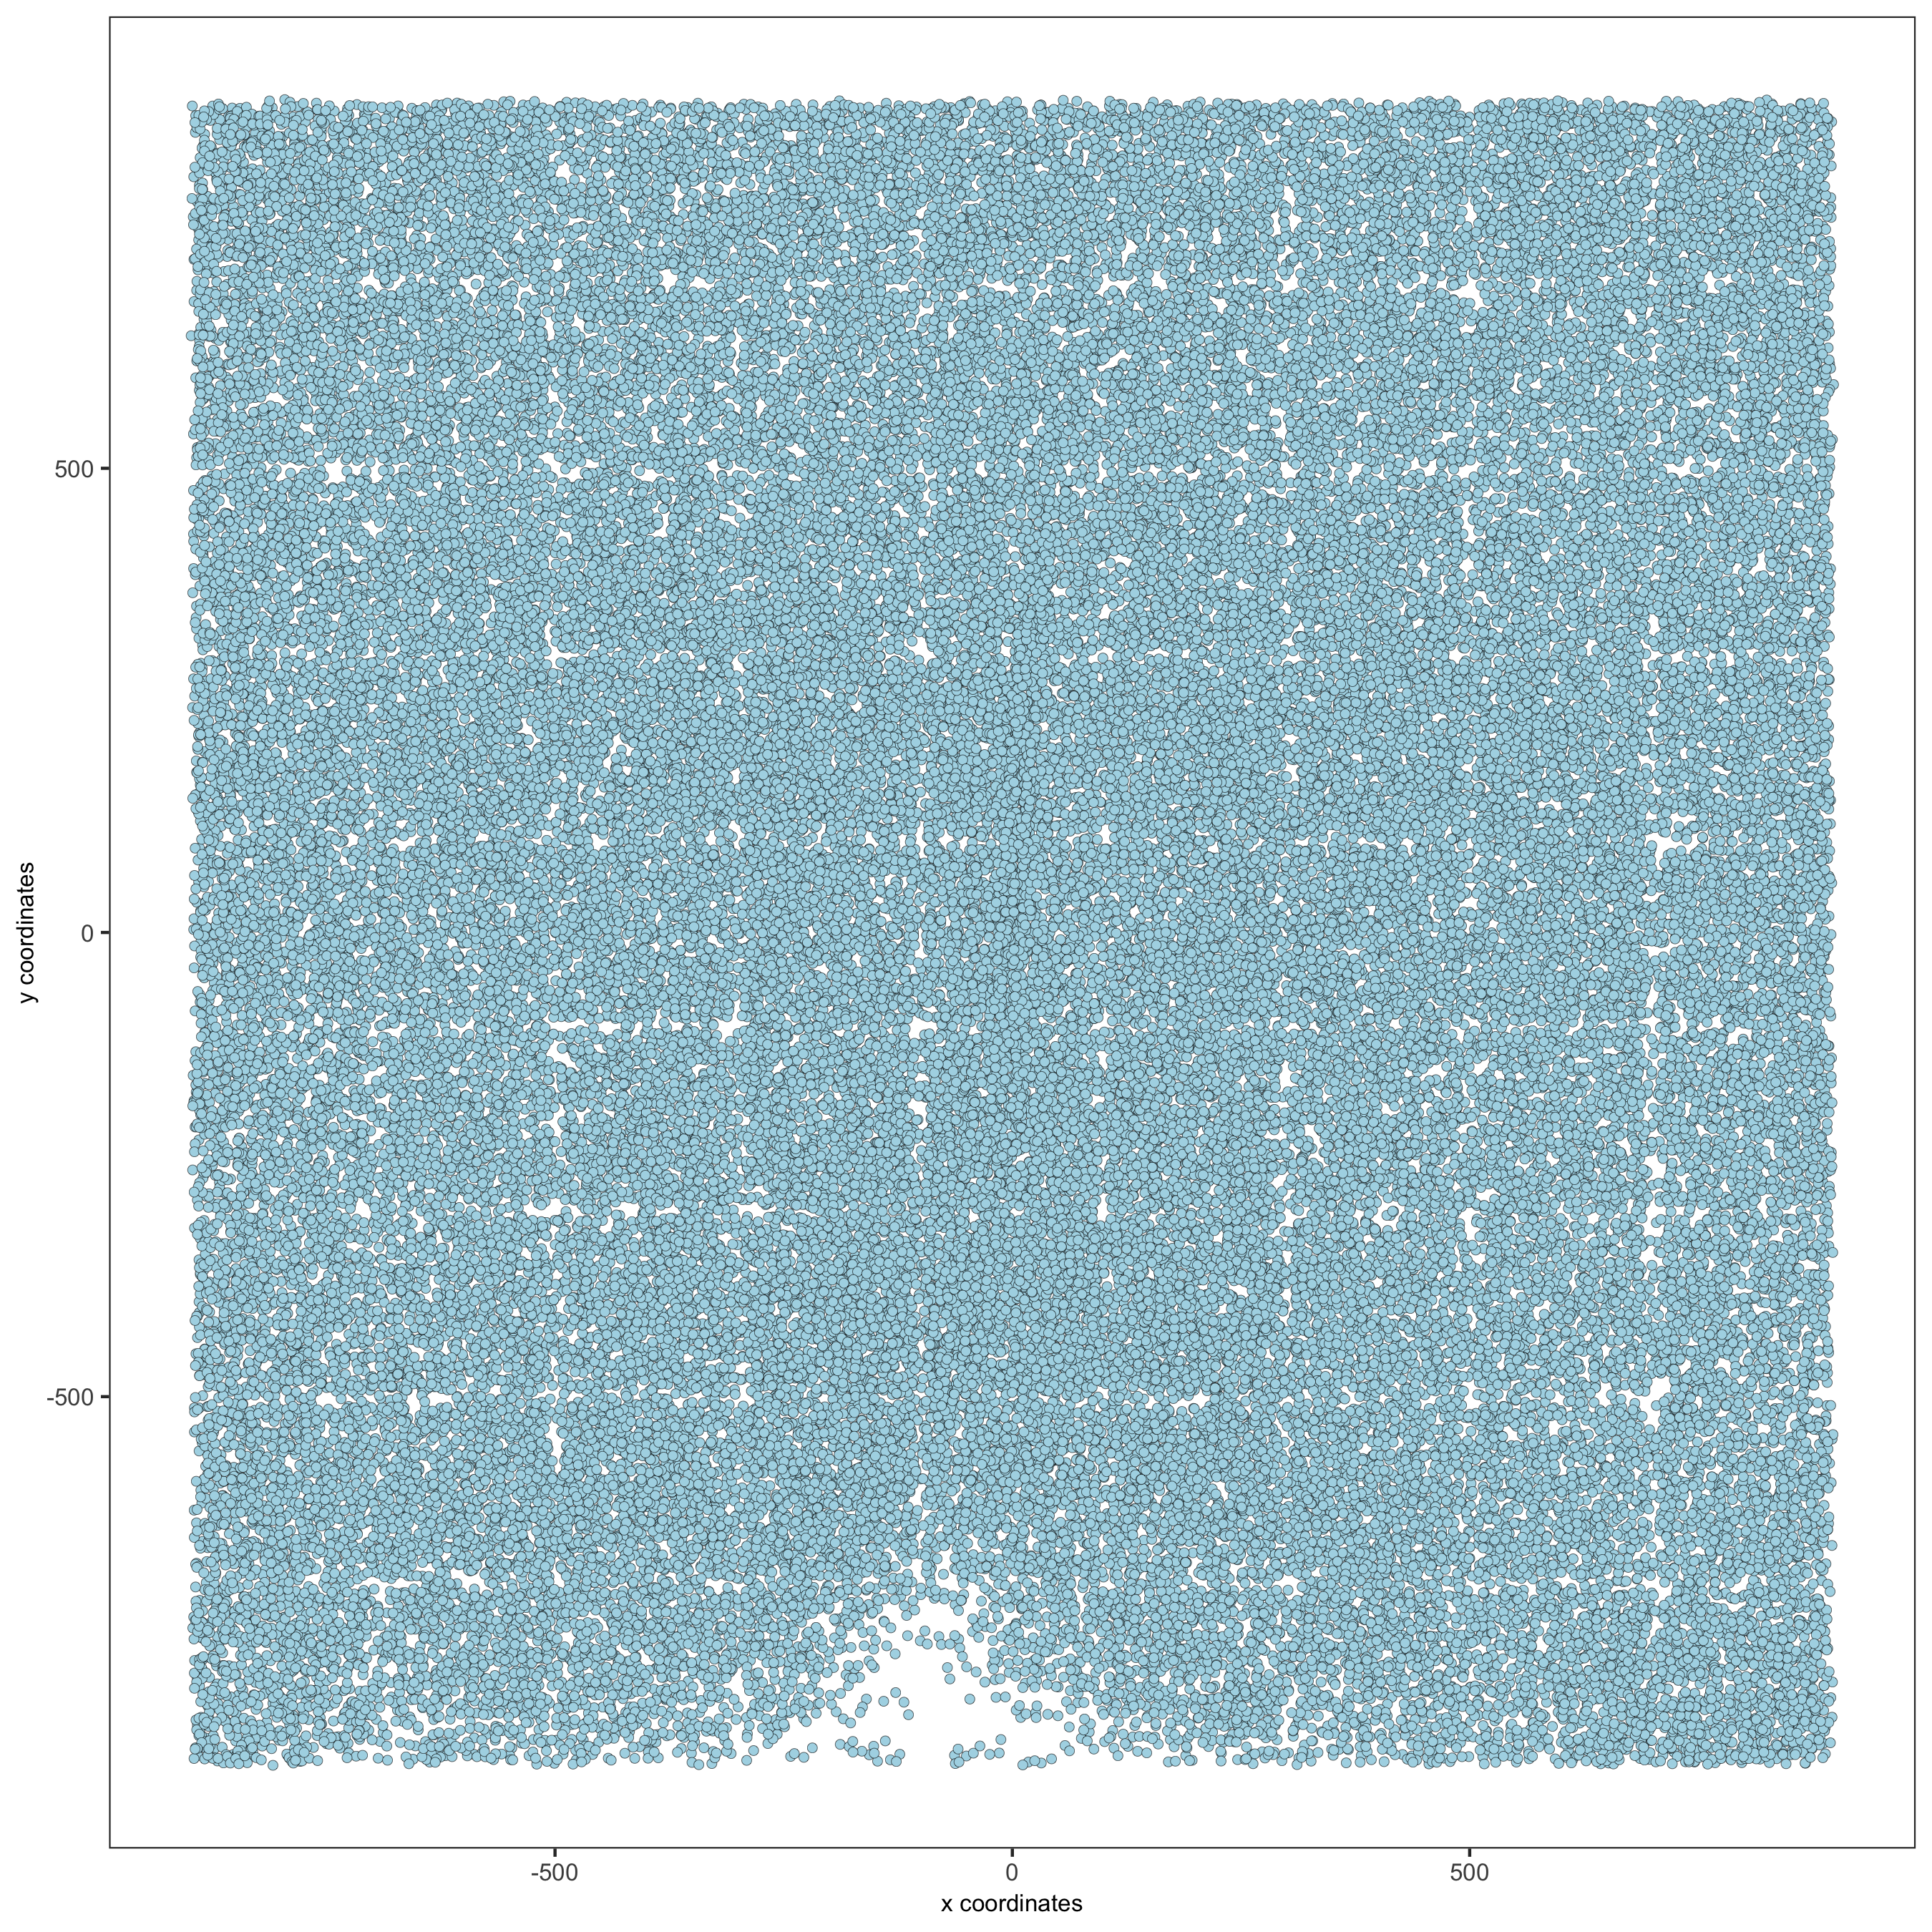
# 2D
spatPlot(gobject = merFISH_test, point_size = 1.5,
ave_param = list(save_name = '2_d_spatial_locations2D'))
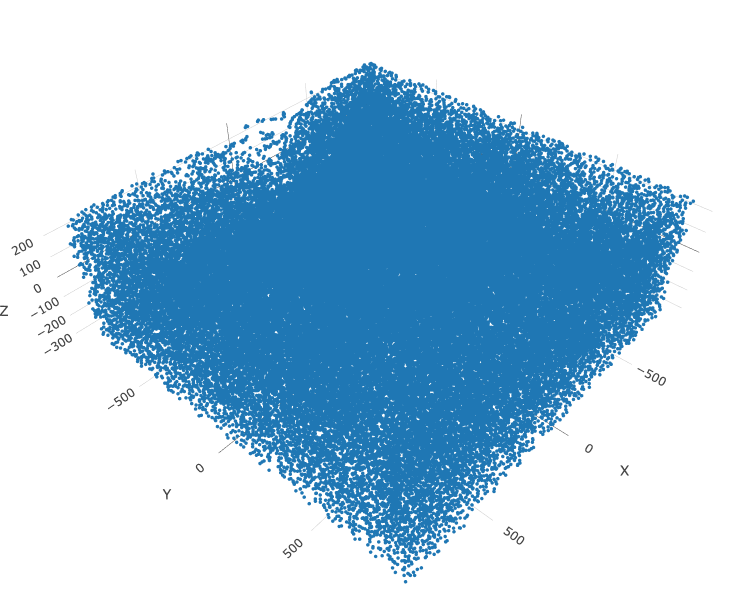
# 3D
spatPlot3D(gobject = merFISH_test, point_size = 2.0, axis_scale = 'real',
    save_param = list(save_name = '2_e_spatial_locations3D'))
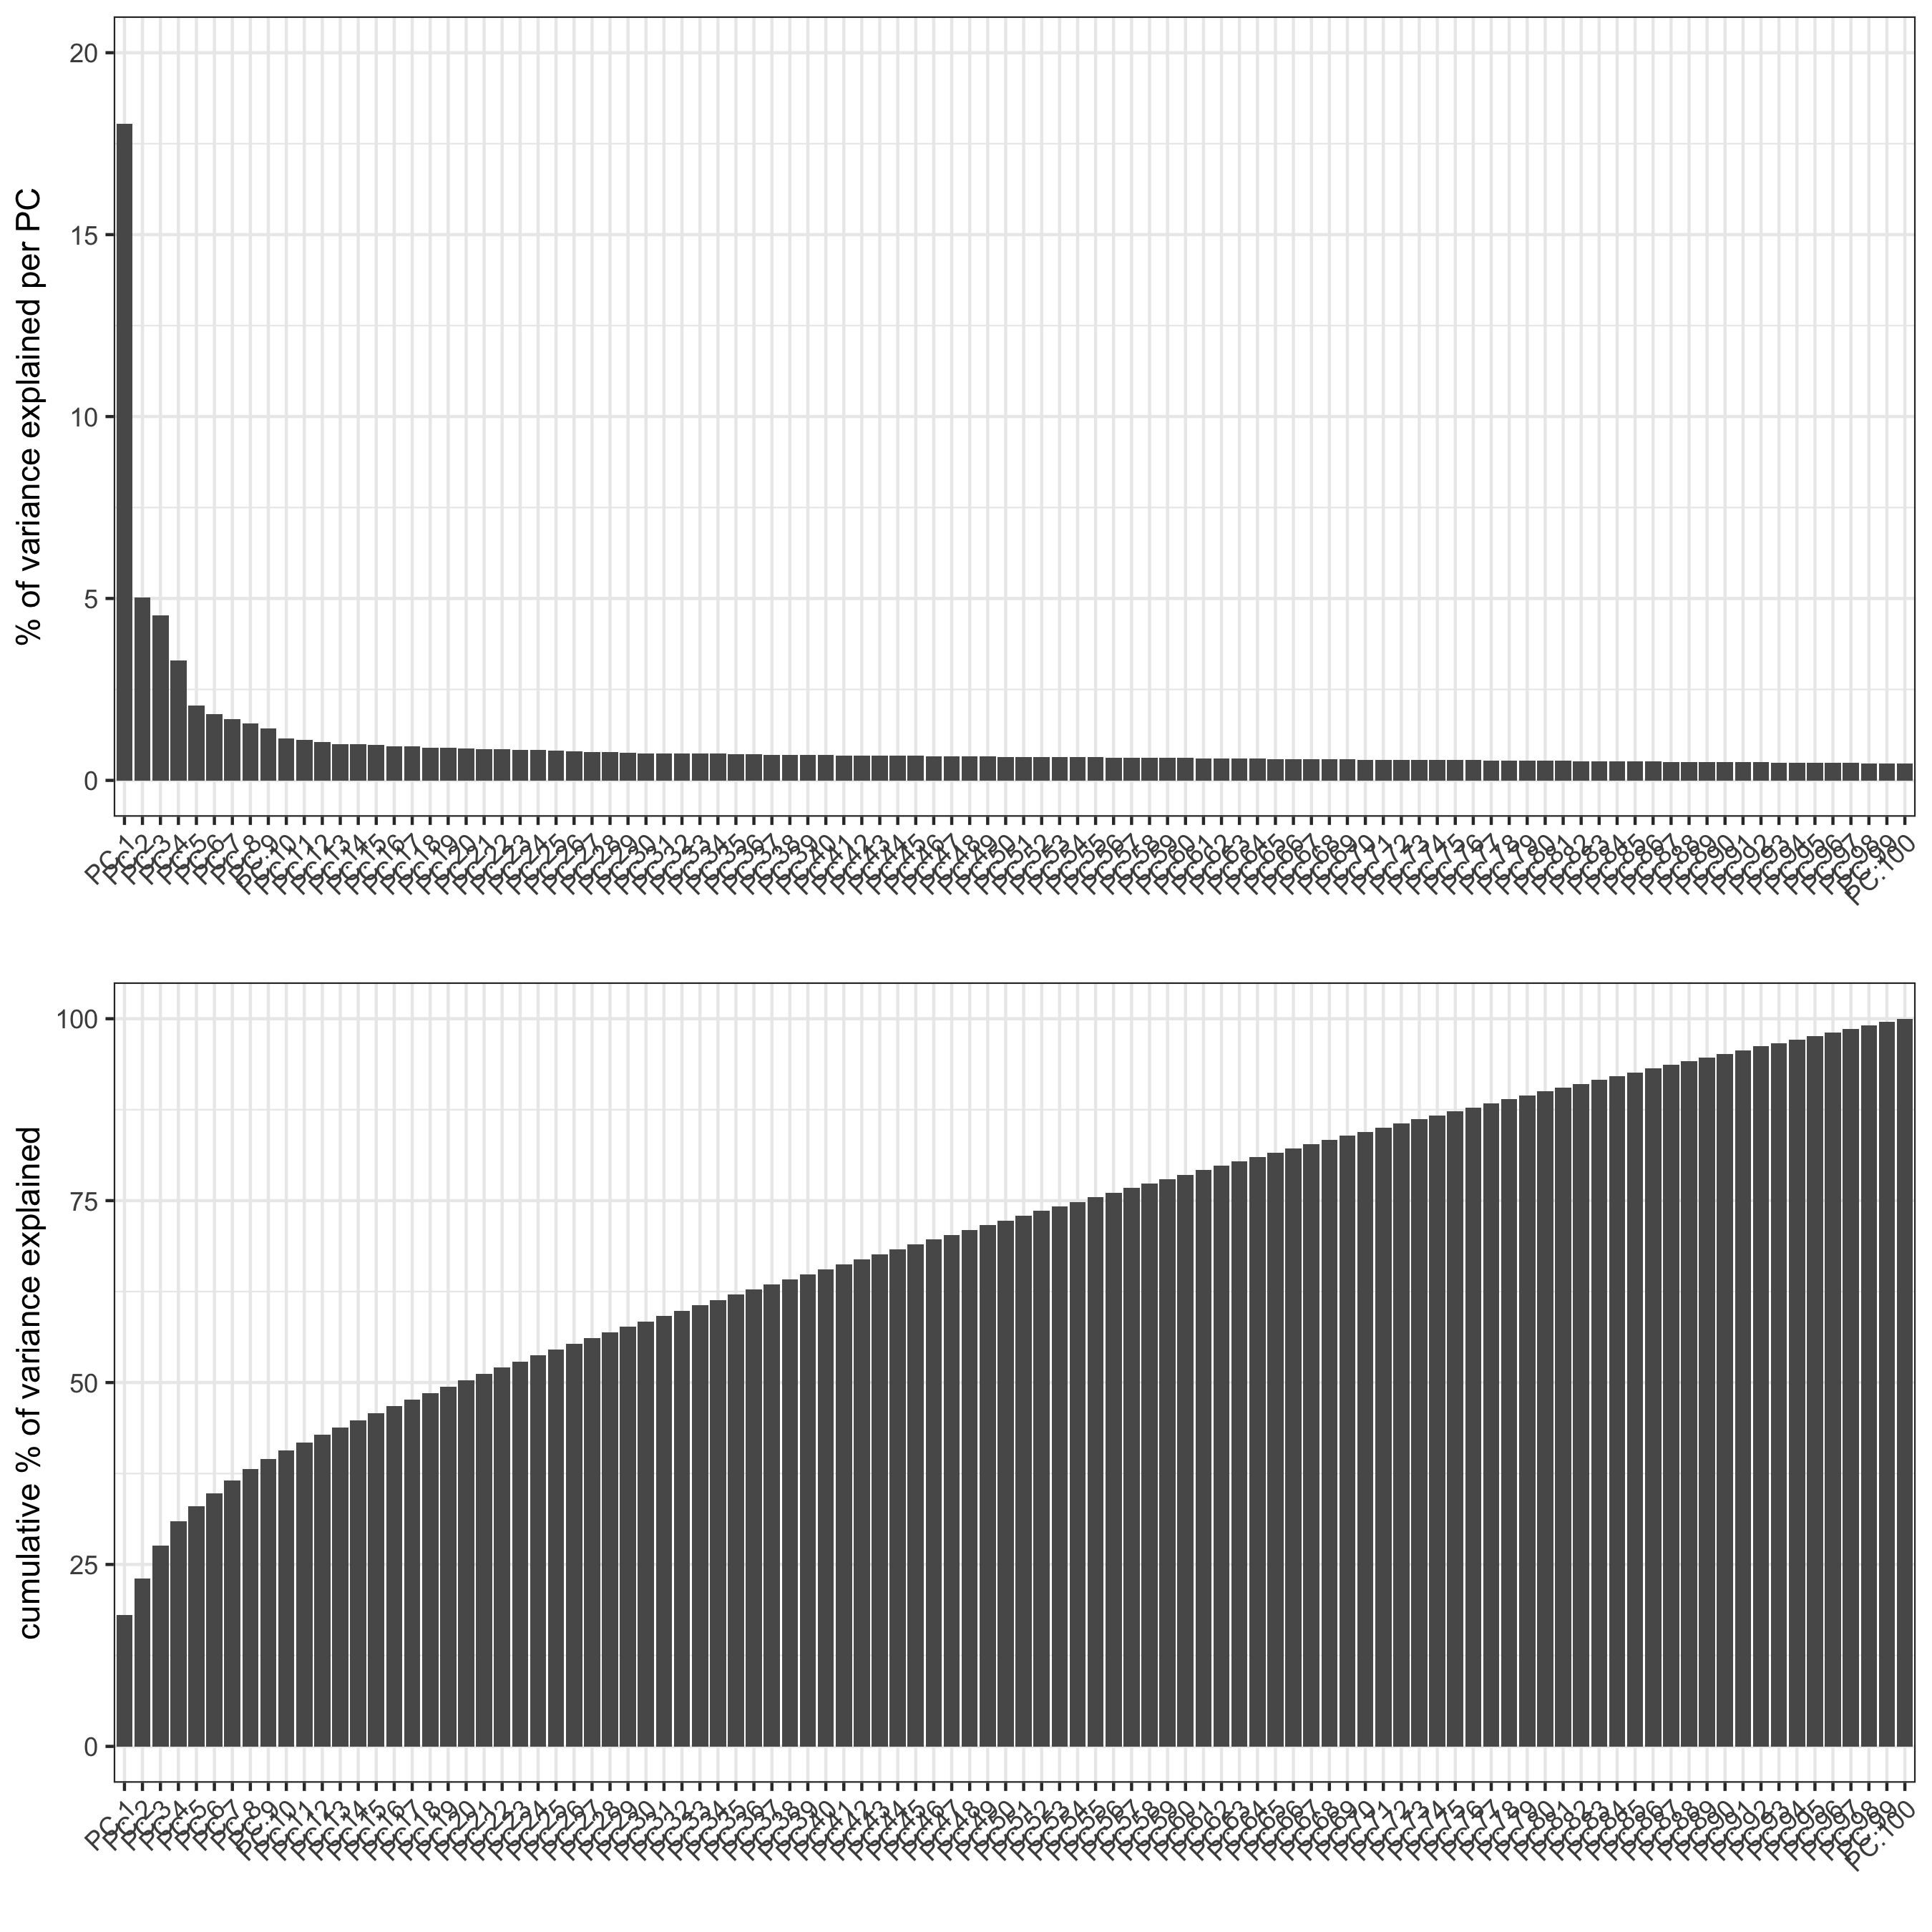
3. Dimension Reduction
# only 155 genes, use them all (default)
merFISH_test <- runPCA(gobject = merFISH_test, genes_to_use = NULL, scale_unit = FALSE, center = TRUE)
screePlot(merFISH_test, save_param = list(save_name = '3_a_screeplot'))
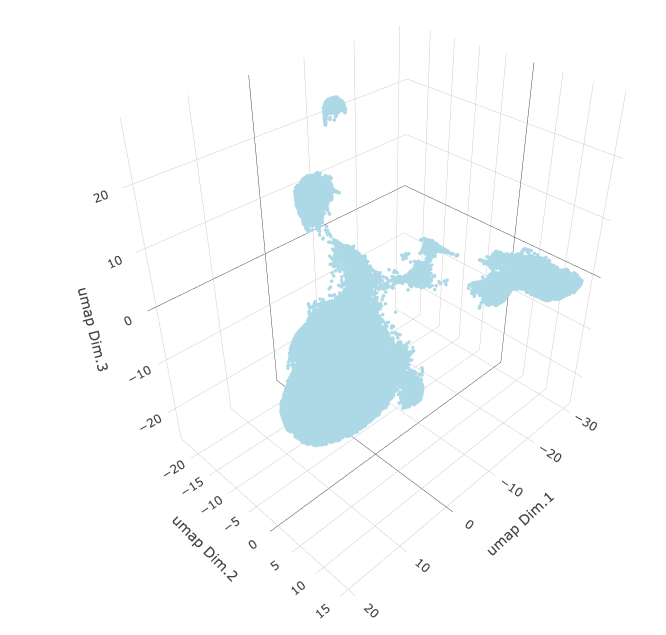
merFISH_test <- runUMAP(merFISH_test, dimensions_to_use = 1:8, n_components = 3, n_threads = 4)

plotUMAP_3D(gobject = merFISH_test, point_size = 1.5,
    save_param = list(save_name = '3_b_UMAP_reduction'))
4. Clustering
## sNN network (default)
merFISH_test <- createNearestNetwork(gobject = merFISH_test, dimensions_to_use = 1:8, k = 15)
## Leiden clustering
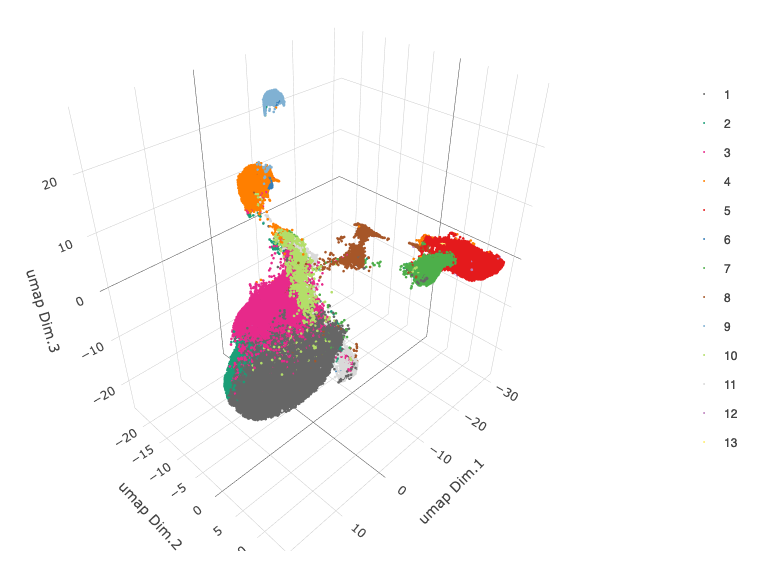
merFISH_test <- doLeidenCluster(gobject = merFISH_test, resolution = 0.2, n_iterations = 200,
name = 'leiden_0.2')
plotUMAP_3D(gobject = merFISH_test, cell_color = 'leiden_0.2', point_size = 1.5, show_center_label = F,
save_param = list(save_name = '4_a_UMAP_leiden'))
5. Co-Visualization
spatDimPlot3D(gobject = merFISH_test, show_center_label = F,
cell_color = 'leiden_0.2', dim3_to_use = 3,
axis_scale = 'real', spatial_point_size = 2.0,
save_param = list(save_name = '5_a_covis_leiden'))
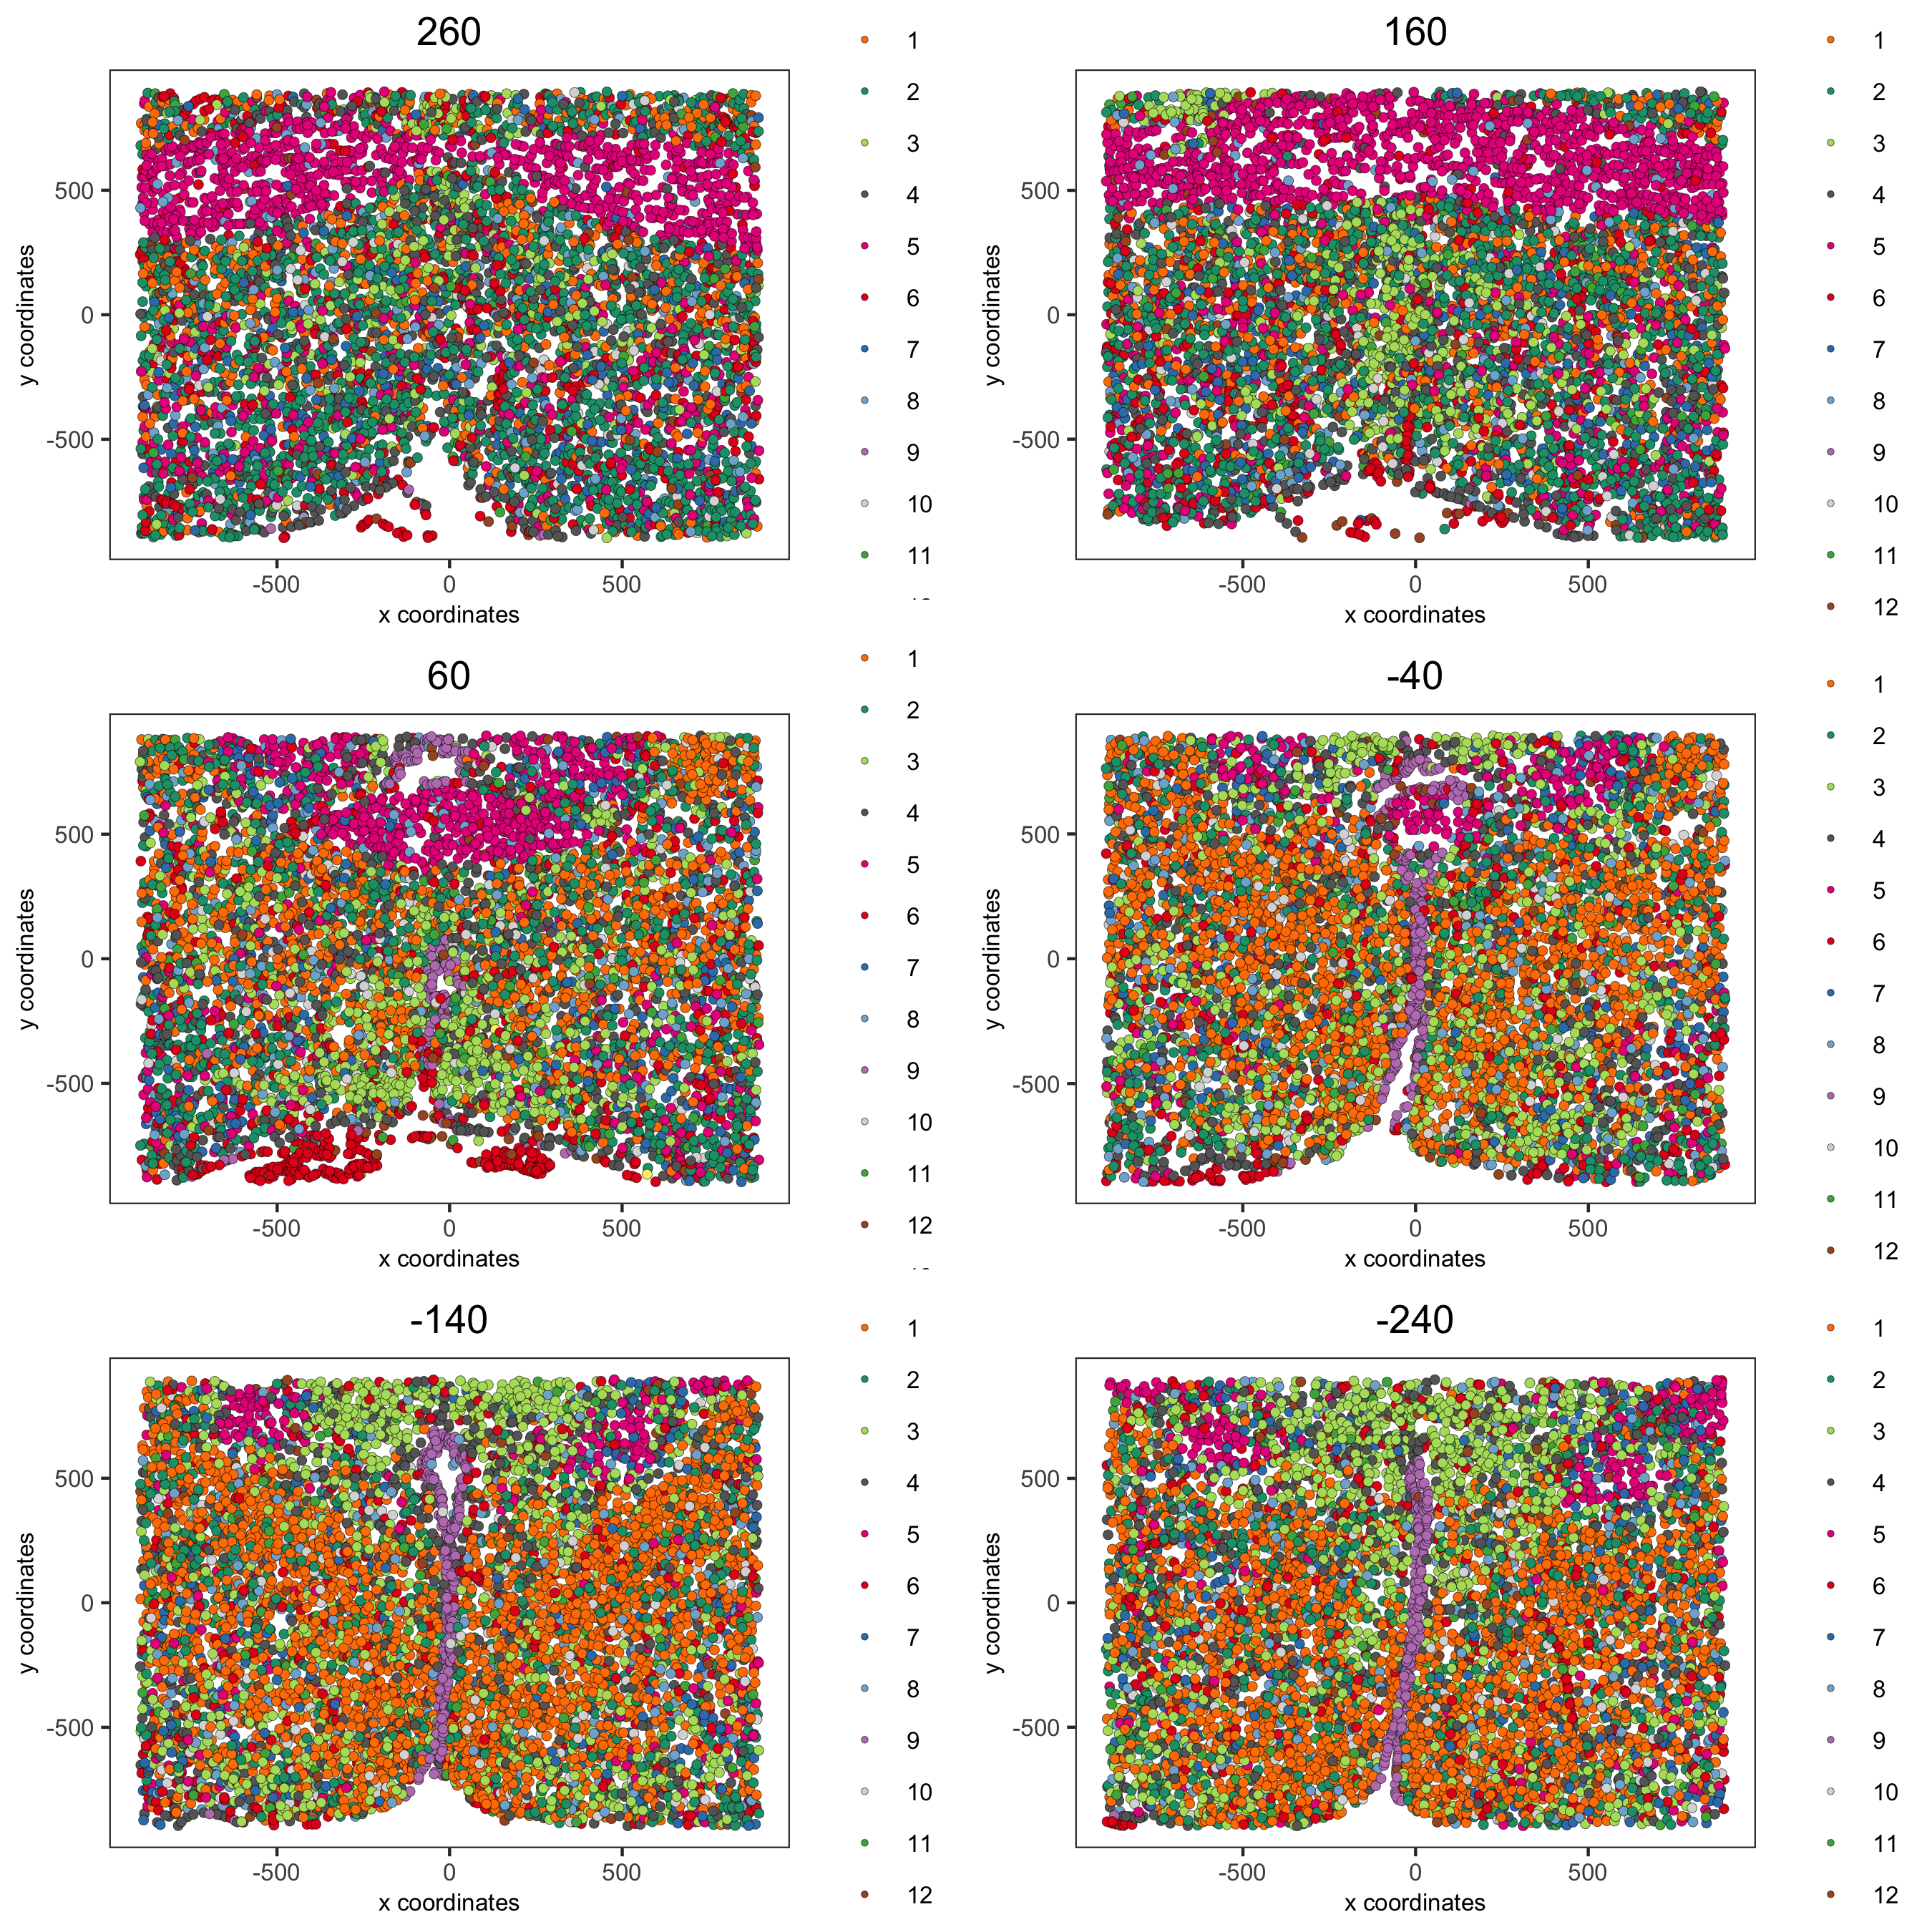
spatPlot2D(gobject = merFISH_test, point_size = 1.5,
cell_color = 'leiden_0.2',
group_by = 'layer_ID', cow_n_col = 2, group_by_subset = c(260, 160, 60, -40, -140, -240),
save_param = list(save_name = '5_b_leiden_2D'))
6. Cell-Type Marker Gene Detection
markers = findMarkers_one_vs_all(gobject = merFISH_test,
method = 'gini',
expression_values = 'normalized',
cluster_column = 'leiden_0.2',
min_genes = 1, rank_score = 2)
markers[, head(.SD, 2), by = 'cluster']
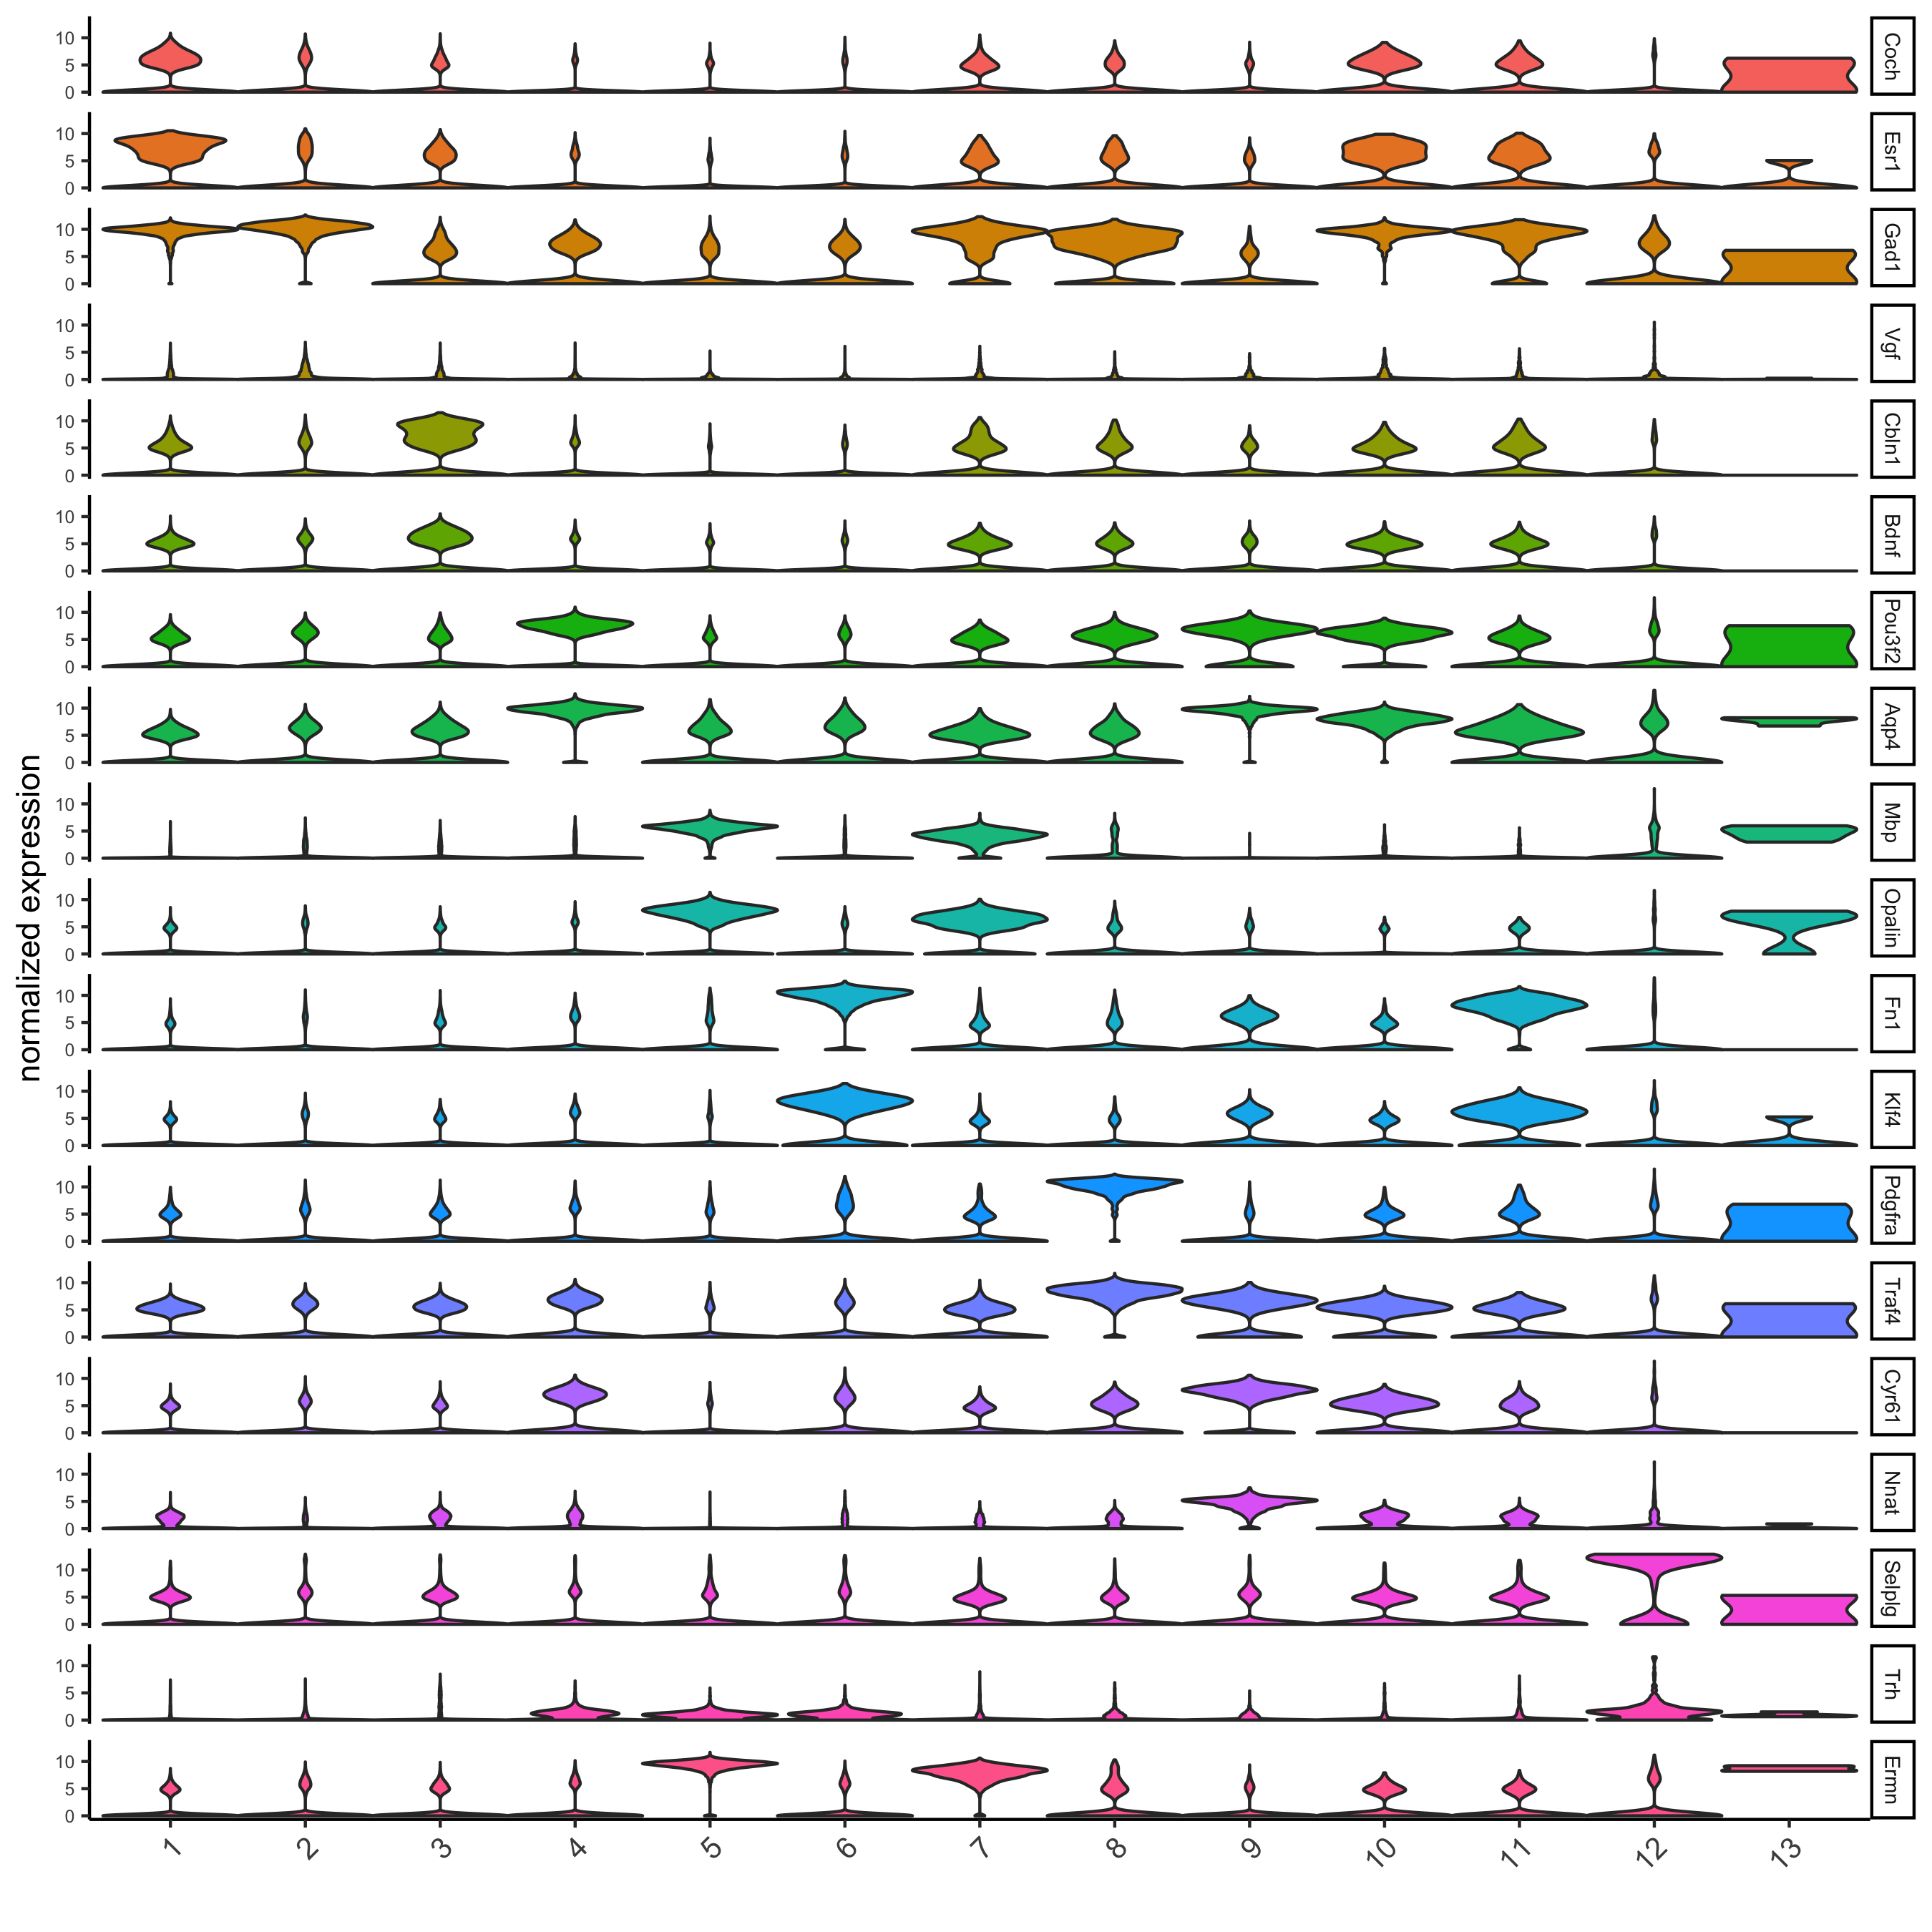
# violinplot
topgini_genes = unique(markers[, head(.SD, 2), by = 'cluster']$genes)
violinPlot(merFISH_test, genes = topgini_genes, cluster_column = 'leiden_0.2', strip_position = 'right',
save_param = c(save_name = '6_a_violinplot'))
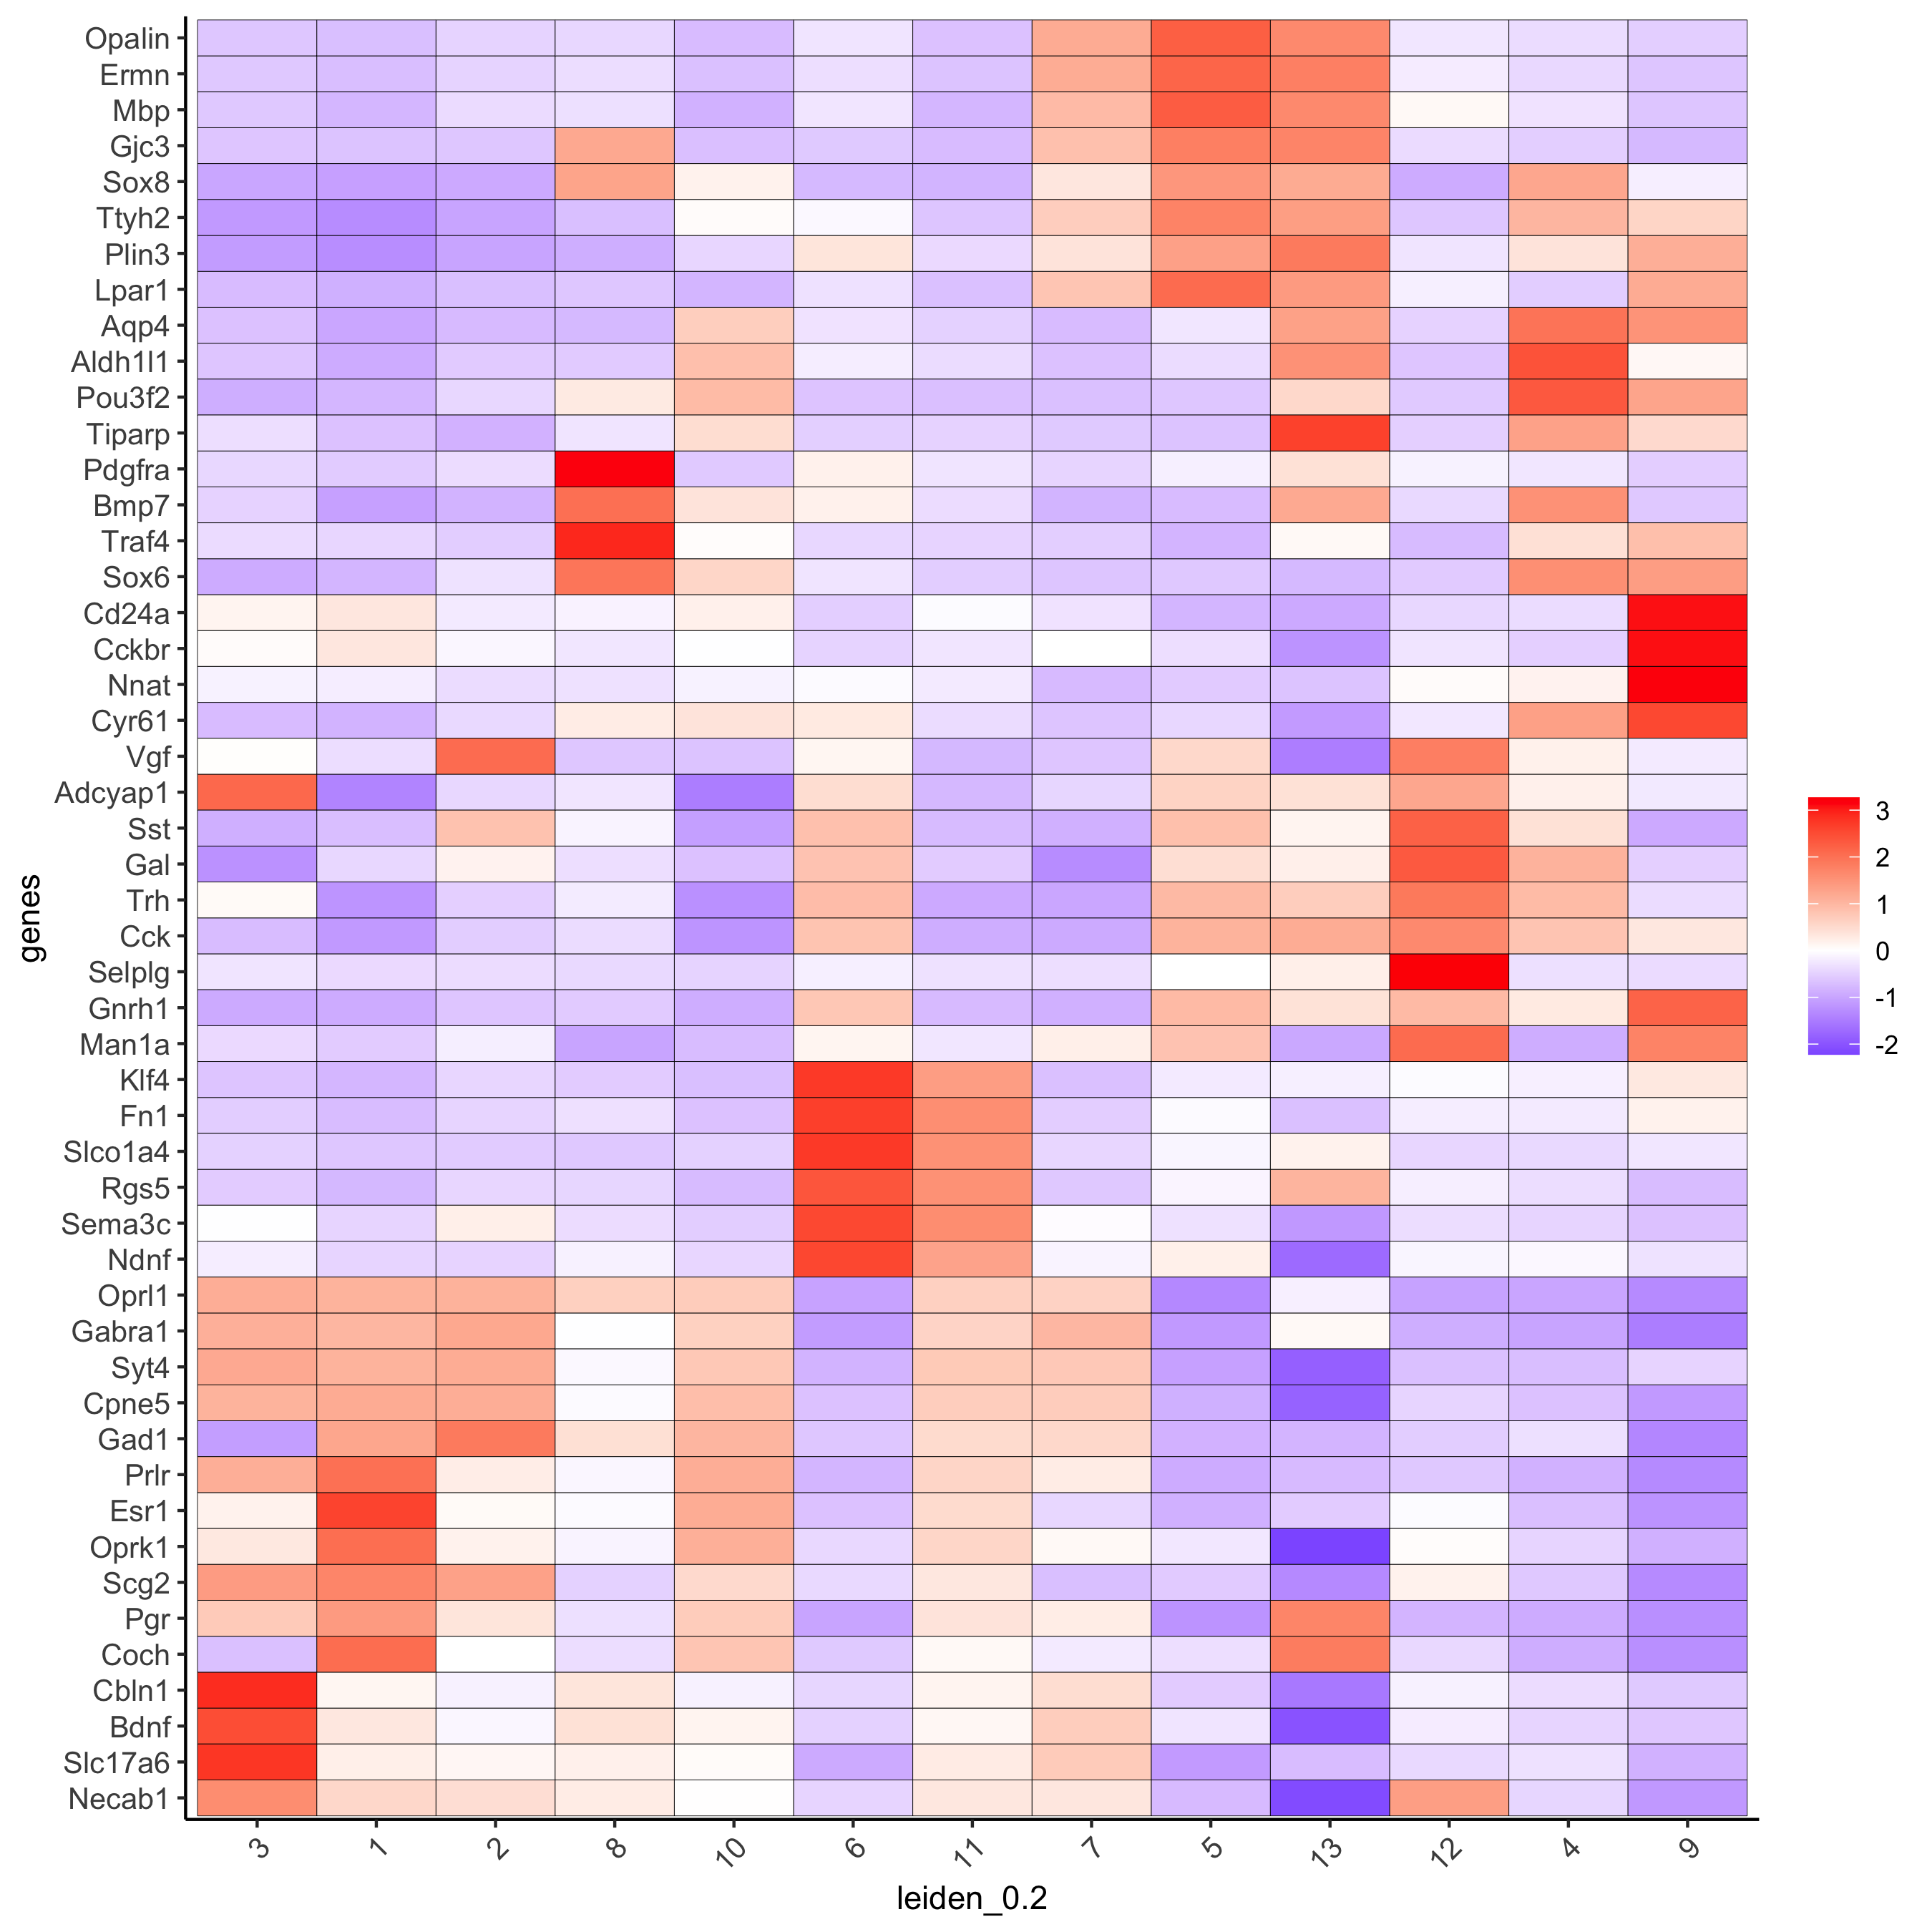
topgini_genes = unique(markers[, head(.SD, 6), by = 'cluster']$genes)
plotMetaDataHeatmap(merFISH_test, expression_values = 'scaled',
        metadata_cols = c('leiden_0.2'),
        selected_genes = topgini_genes,
        save_param = c(save_name = '6_b_clusterheatmap_markers'))
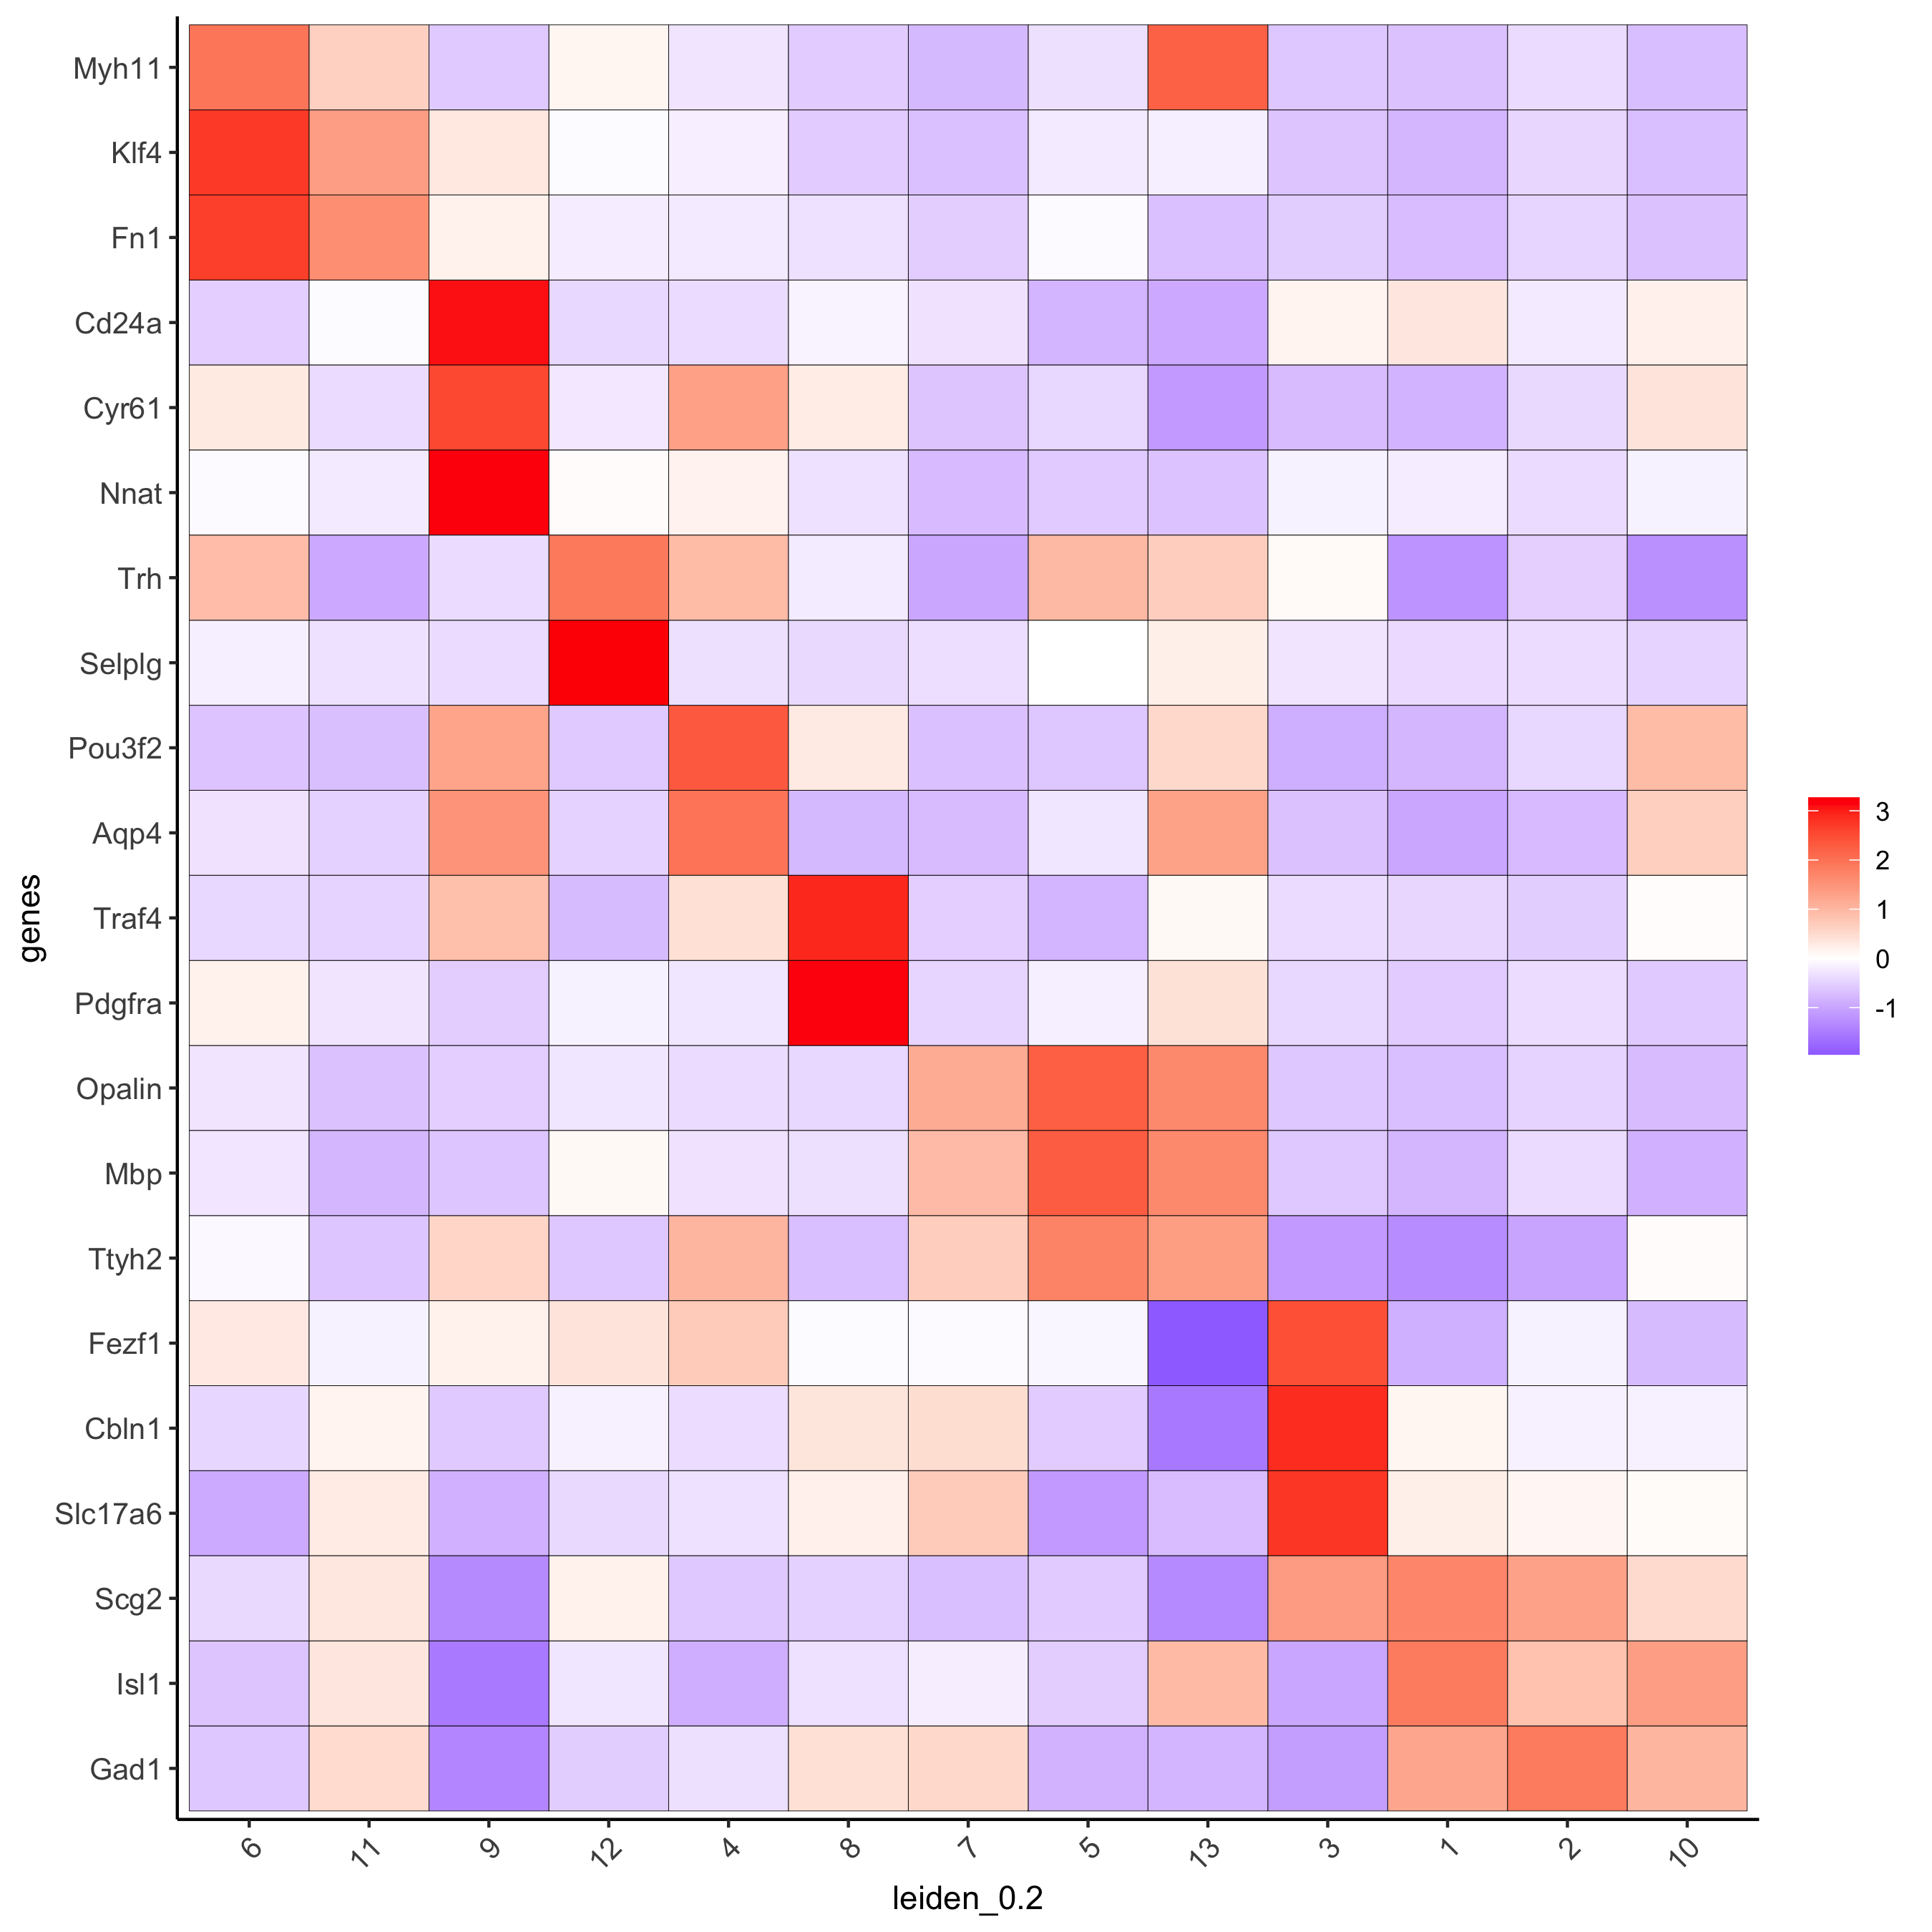
7. Cell-Type Annotation and Visualization
7.1 Annotation
# known markers and DEGs
selected_genes = c('Myh11', 'Klf4', 'Fn1', 'Cd24a', 'Cyr61', 'Nnat', 'Trh', 'Selplg', 'Pou3f2', 'Aqp4', 'Traf4',
       'Pdgfra', 'Opalin', 'Mbp', 'Ttyh2', 'Fezf1', 'Cbln1', 'Slc17a6', 'Scg2', 'Isl1', 'Gad1')
cluster_order = c(6, 11, 9, 12, 4, 8, 7, 5, 13, 3, 1, 2, 10)

plotMetaDataHeatmap(merFISH_test, expression_values = 'scaled',
        metadata_cols = c('leiden_0.2'),
        selected_genes = selected_genes,
        custom_gene_order = rev(selected_genes),
        custom_cluster_order = cluster_order,
        save_param = c(save_name = '7_a_clusterheatmap_markers'))
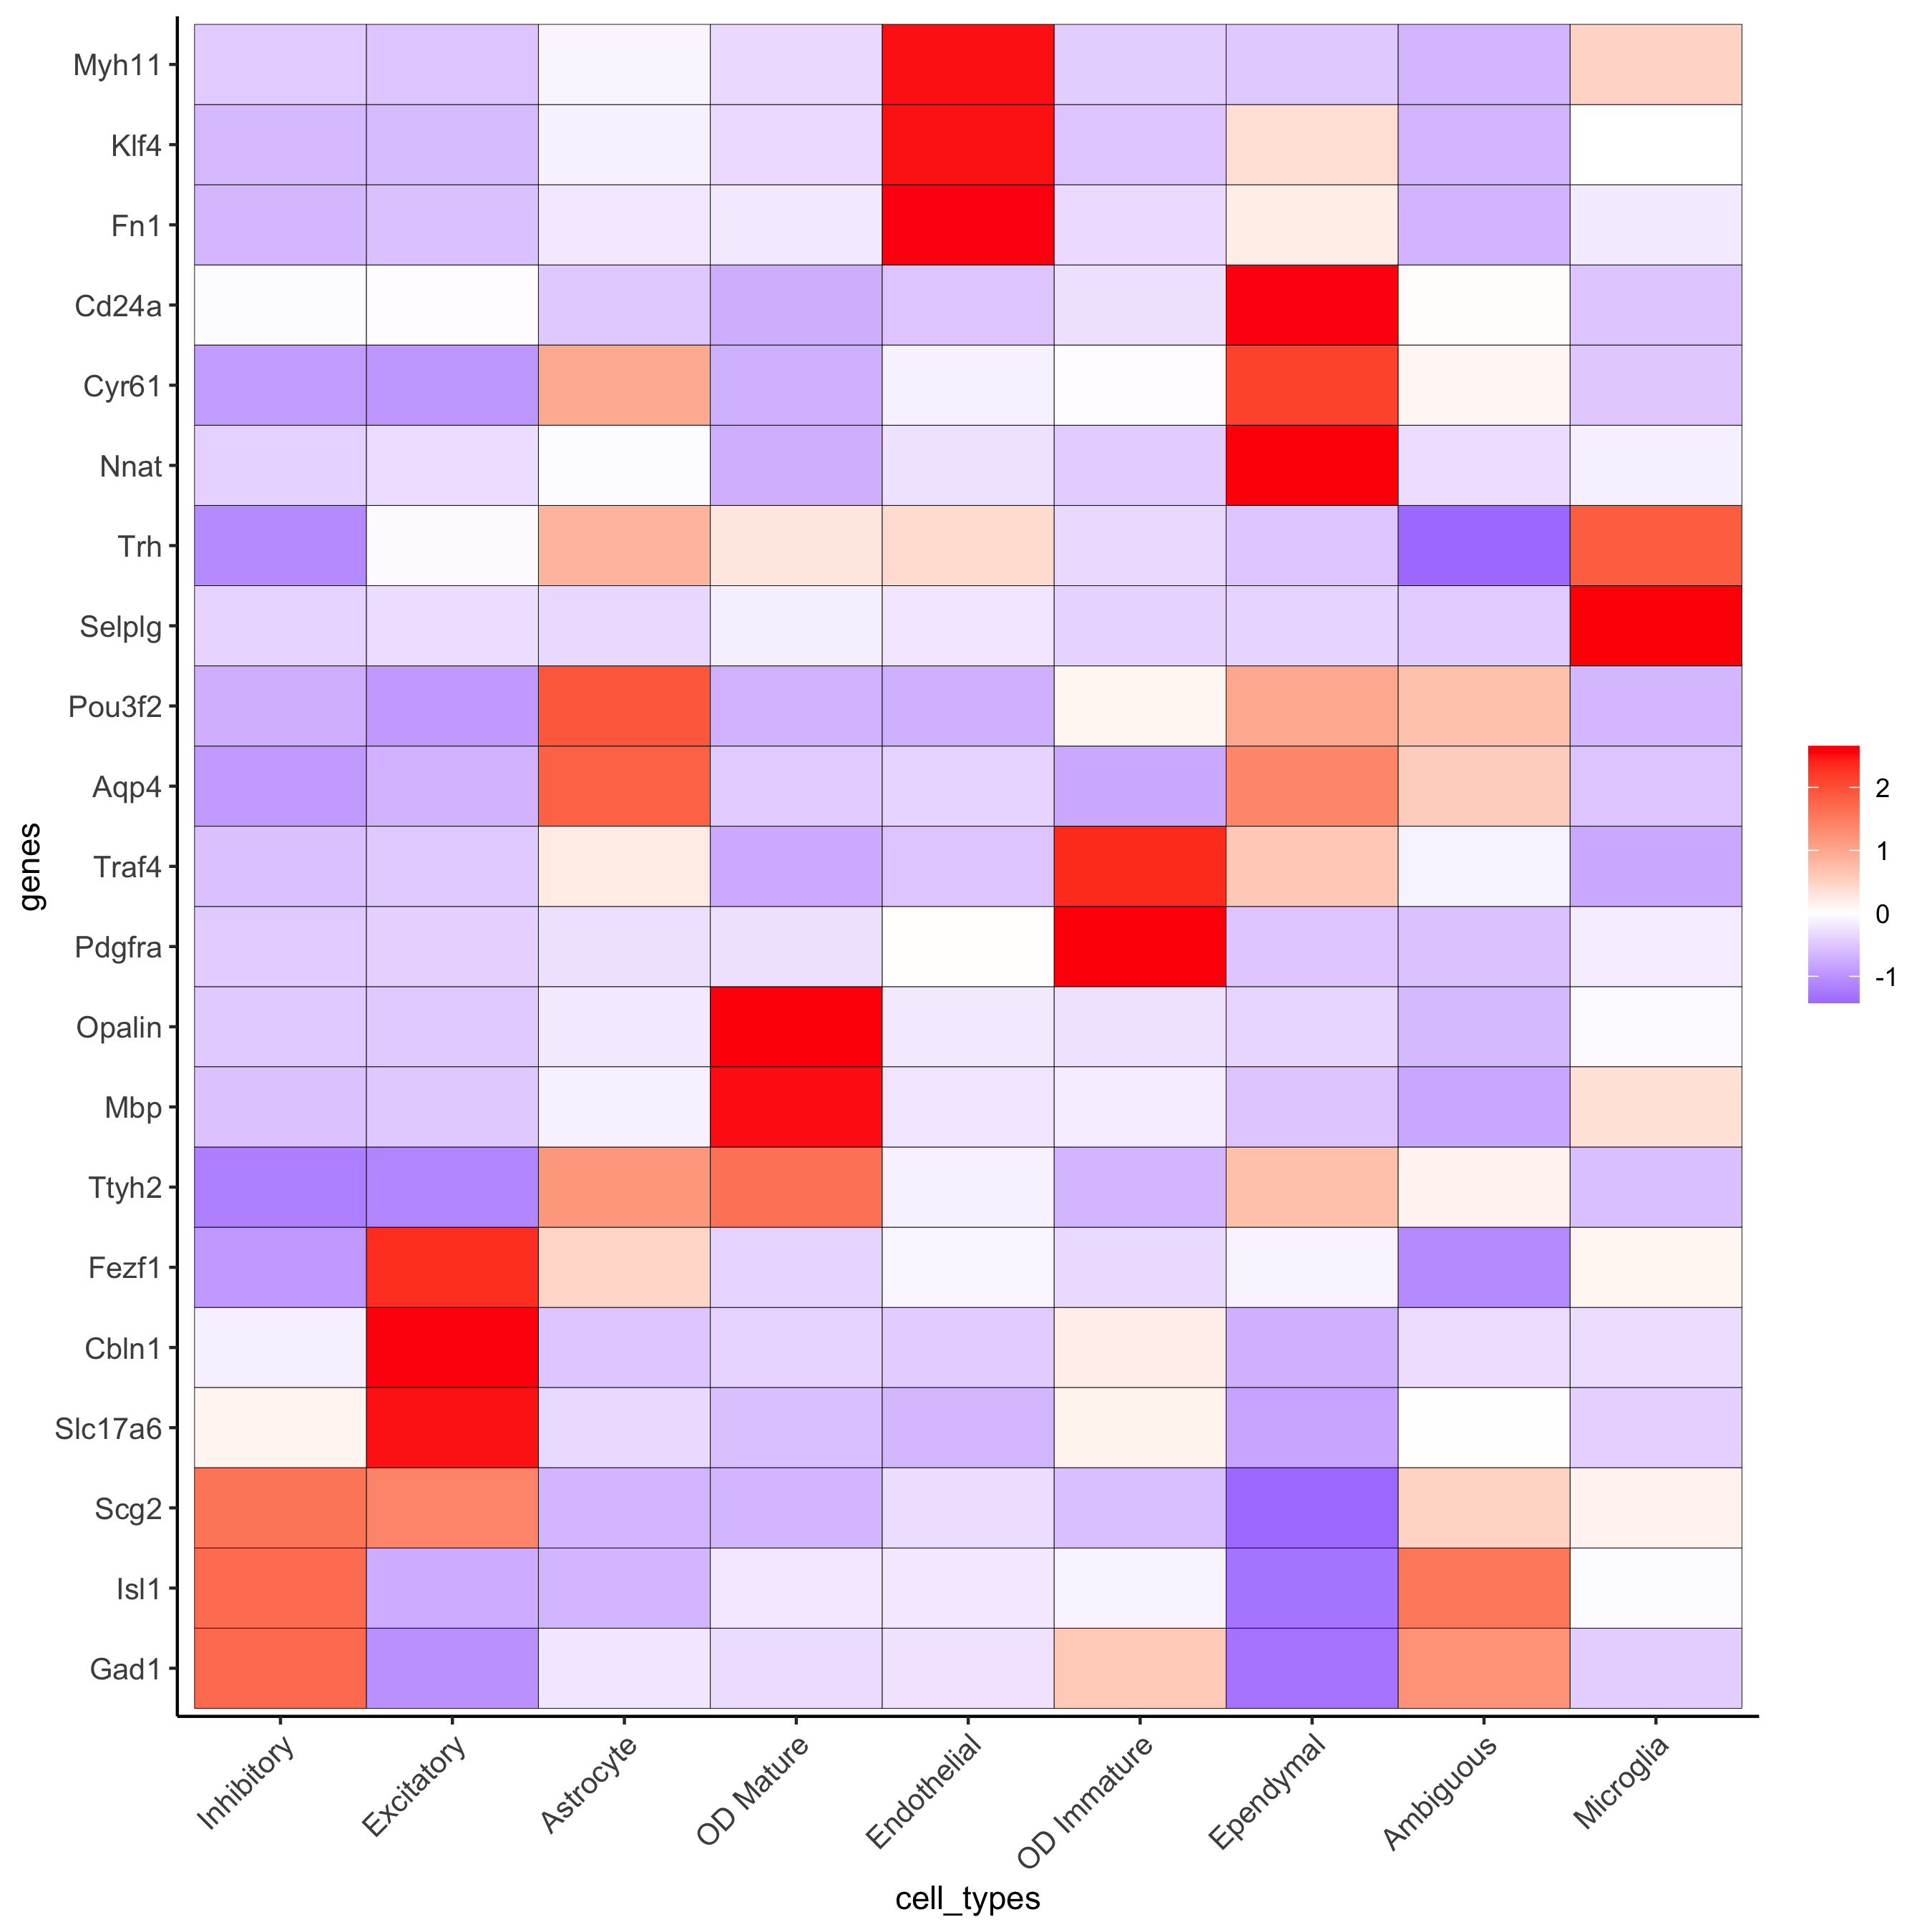
## name clusters
clusters_cell_types_hypo = c('Inhibitory', 'Inhibitory', 'Excitatory', 'Astrocyte','OD Mature', 'Endothelial',
             'OD Mature', 'OD Immature', 'Ependymal', 'Ambiguous', 'Endothelial', 'Microglia', 'OD Mature')
names(clusters_cell_types_hypo) = as.character(sort(cluster_order))
merFISH_test = annotateGiotto(gobject = merFISH_test, annotation_vector = clusters_cell_types_hypo,
              cluster_column = 'leiden_0.2', name = 'cell_types')

## show heatmap
plotMetaDataHeatmap(merFISH_test, expression_values = 'scaled',
        metadata_cols = c('cell_types'),
        selected_genes = selected_genes,
        custom_gene_order = rev(selected_genes),
        custom_cluster_order = clusters_cell_types_hypo,
        save_param = c(save_name = '7_b_clusterheatmap_markers_celltypes'))
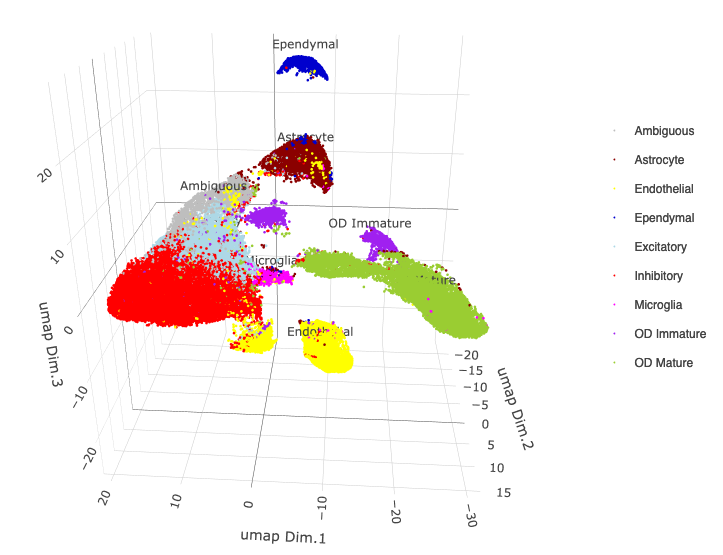
7.1 Visualization
## visualize ##
mycolorcode = c('red', 'lightblue', 'yellowgreen','purple', 'darkred', 'magenta', 'mediumblue', 'yellow', 'gray')
names(mycolorcode) = c('Inhibitory', 'Excitatory','OD Mature', 'OD Immature', 'Astrocyte', 'Microglia',         'Ependymal','Endothelial', 'Ambiguous')

plotUMAP_3D(merFISH_test, cell_color = 'cell_types', point_size = 1.5, cell_color_code = mycolorcode,
    save_param = c(save_name = '7_c_umap_cell_types'))
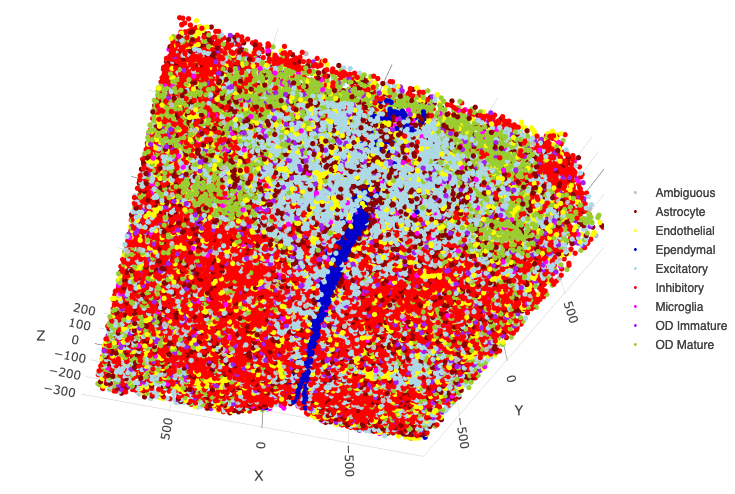
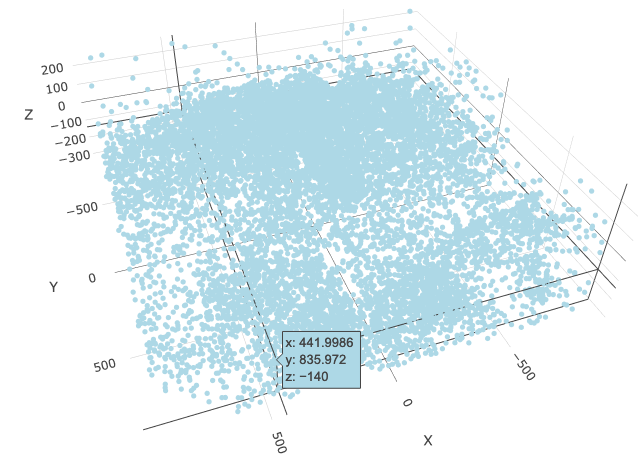
spatPlot3D(merFISH_test,
    cell_color = 'cell_types', axis_scale = 'real',
    sdimx = 'sdimx', sdimy = 'sdimy', sdimz = 'sdimz',
    show_grid = F, cell_color_code = mycolorcode,
    save_param = c(save_name = '7_d_spatPlot_cell_types_all'))
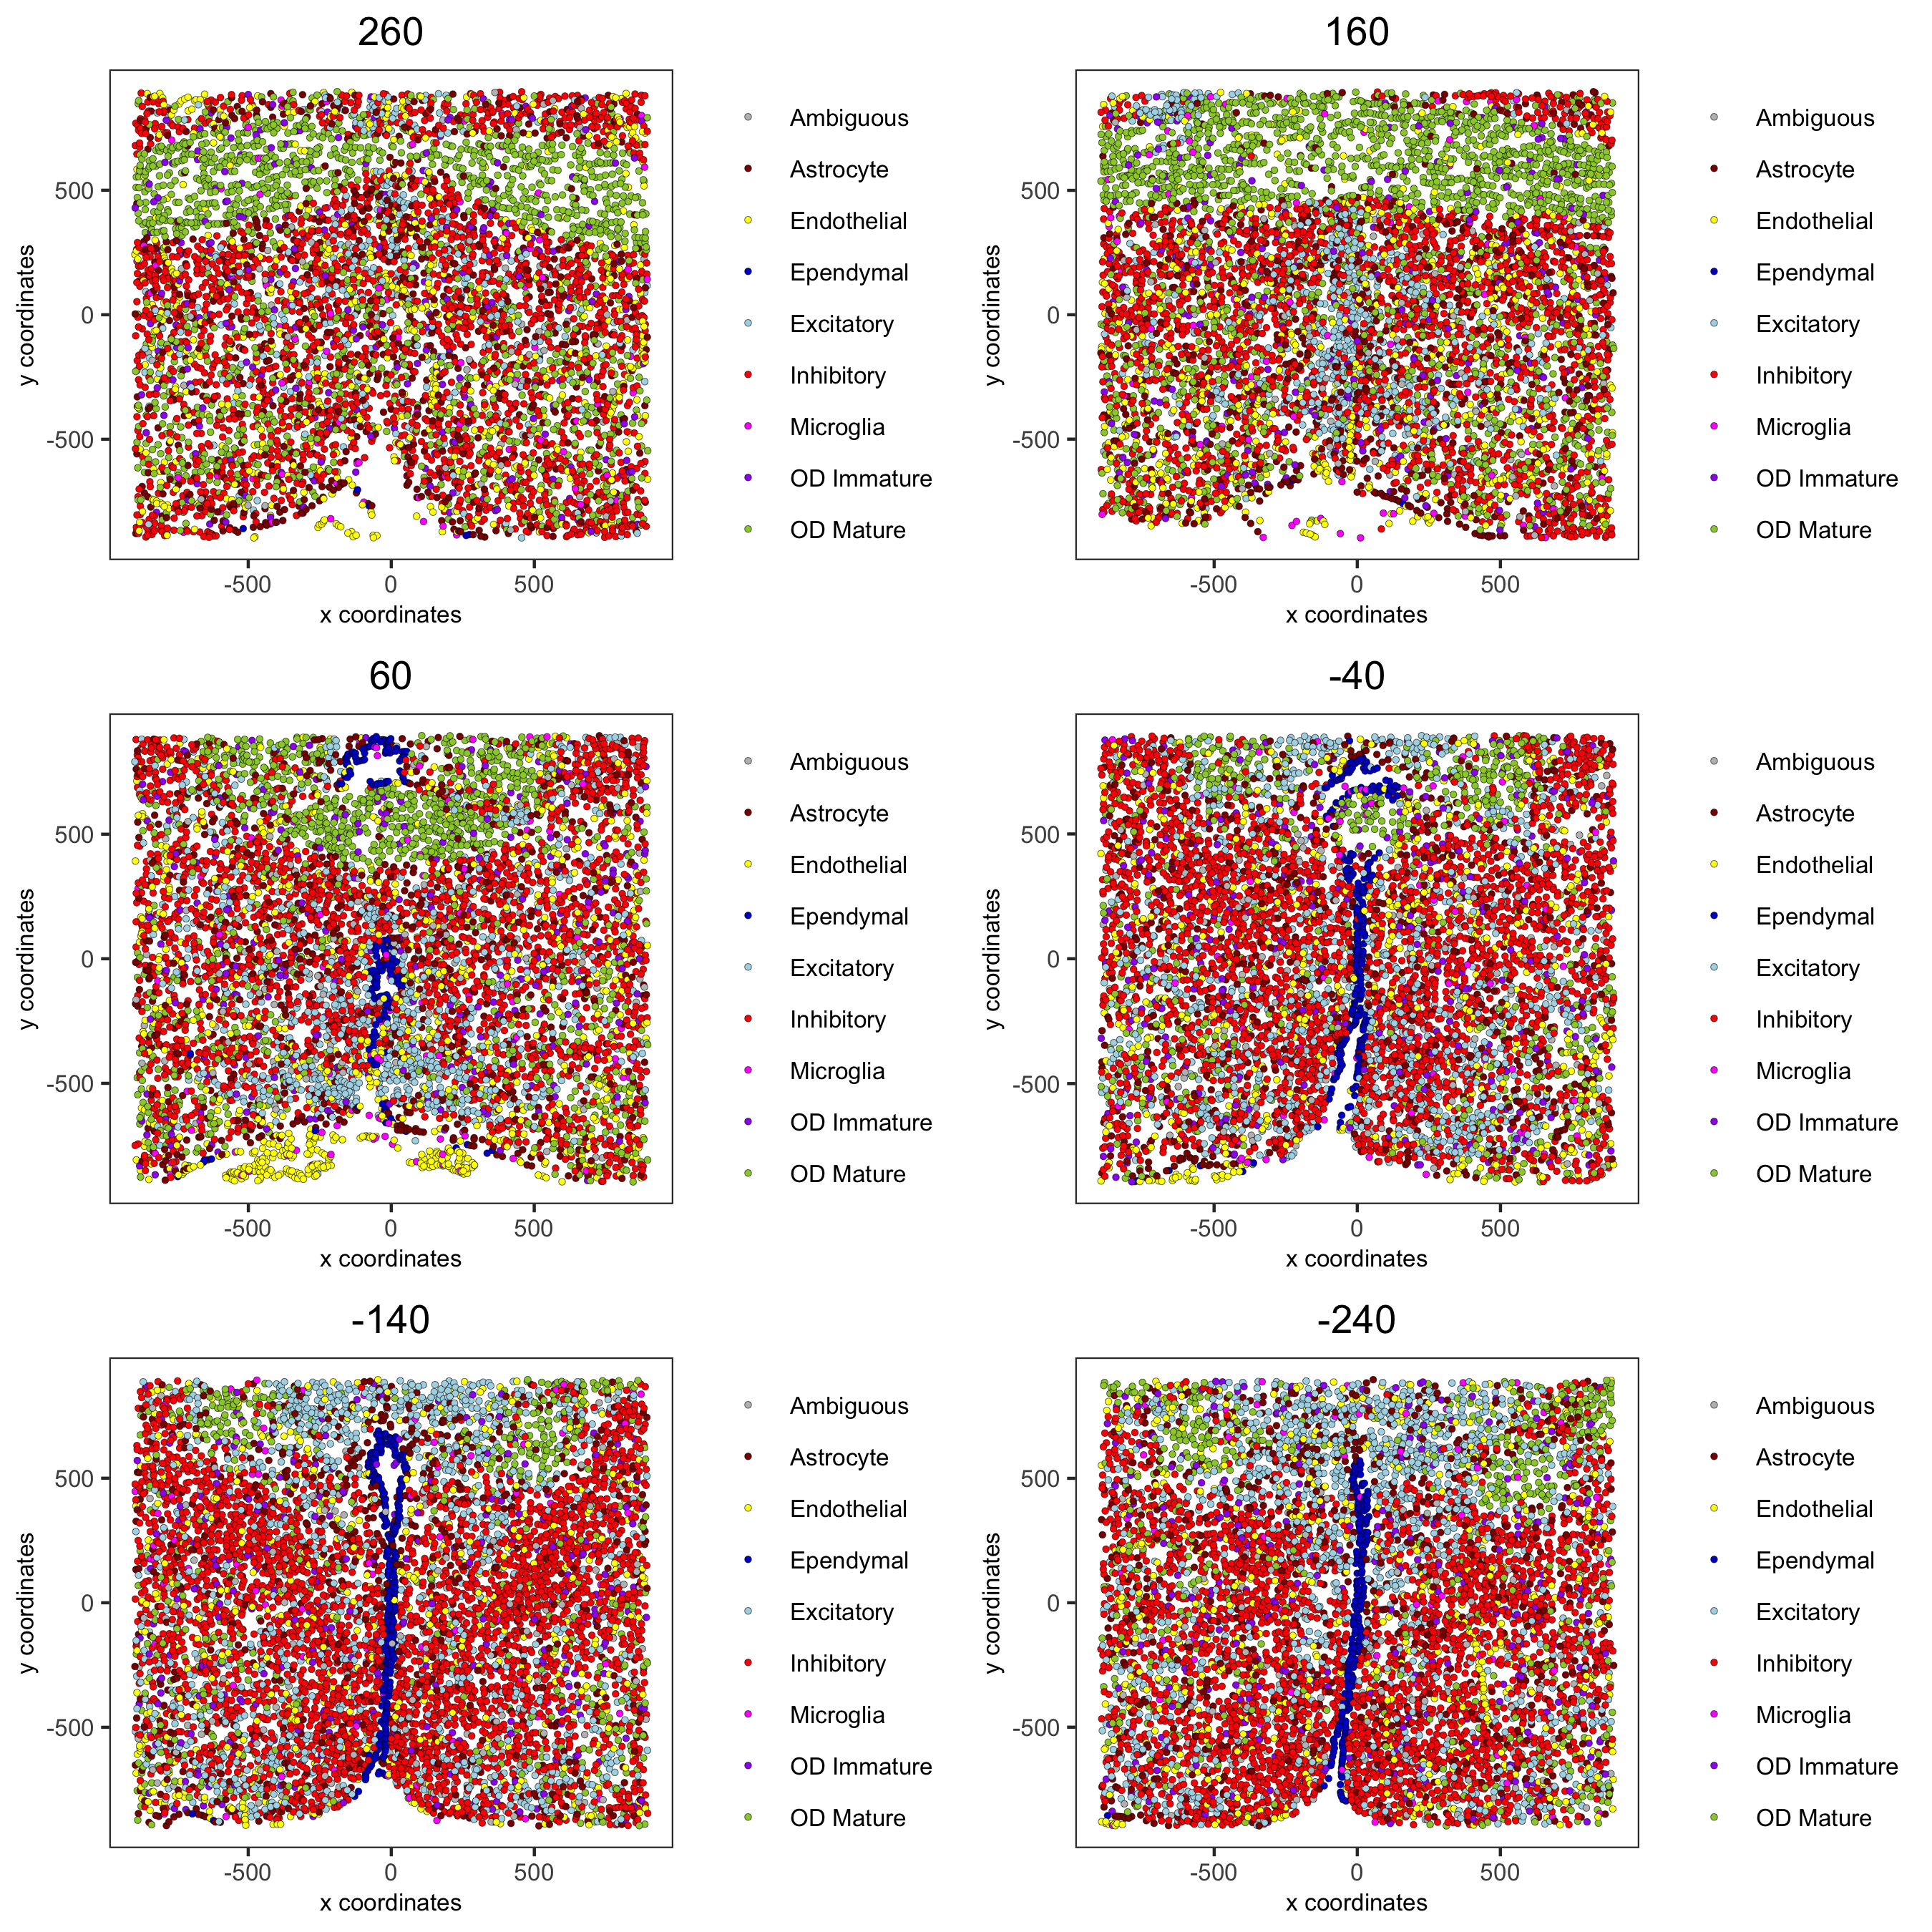
spatPlot2D(gobject = merFISH_test, point_size = 1.0,
    cell_color = 'cell_types', cell_color_code = mycolorcode,
    group_by = 'layer_ID', cow_n_col = 2, group_by_subset = c(seq(260, -290, -100)),
    save_param = c(save_name = '7_e_spatPlot2D_cell_types_all'))
7.3 Excitatory Cells Only
spatPlot3D(merFISH_test,
    cell_color = 'cell_types', axis_scale = 'real',
    sdimx = 'sdimx', sdimy = 'sdimy', sdimz = 'sdimz',
    show_grid = F, cell_color_code = mycolorcode,
    select_cell_groups = 'Excitatory', show_other_cells = F,
    save_param = c(save_name = '7_f_spatPlot_cell_types_excit'))
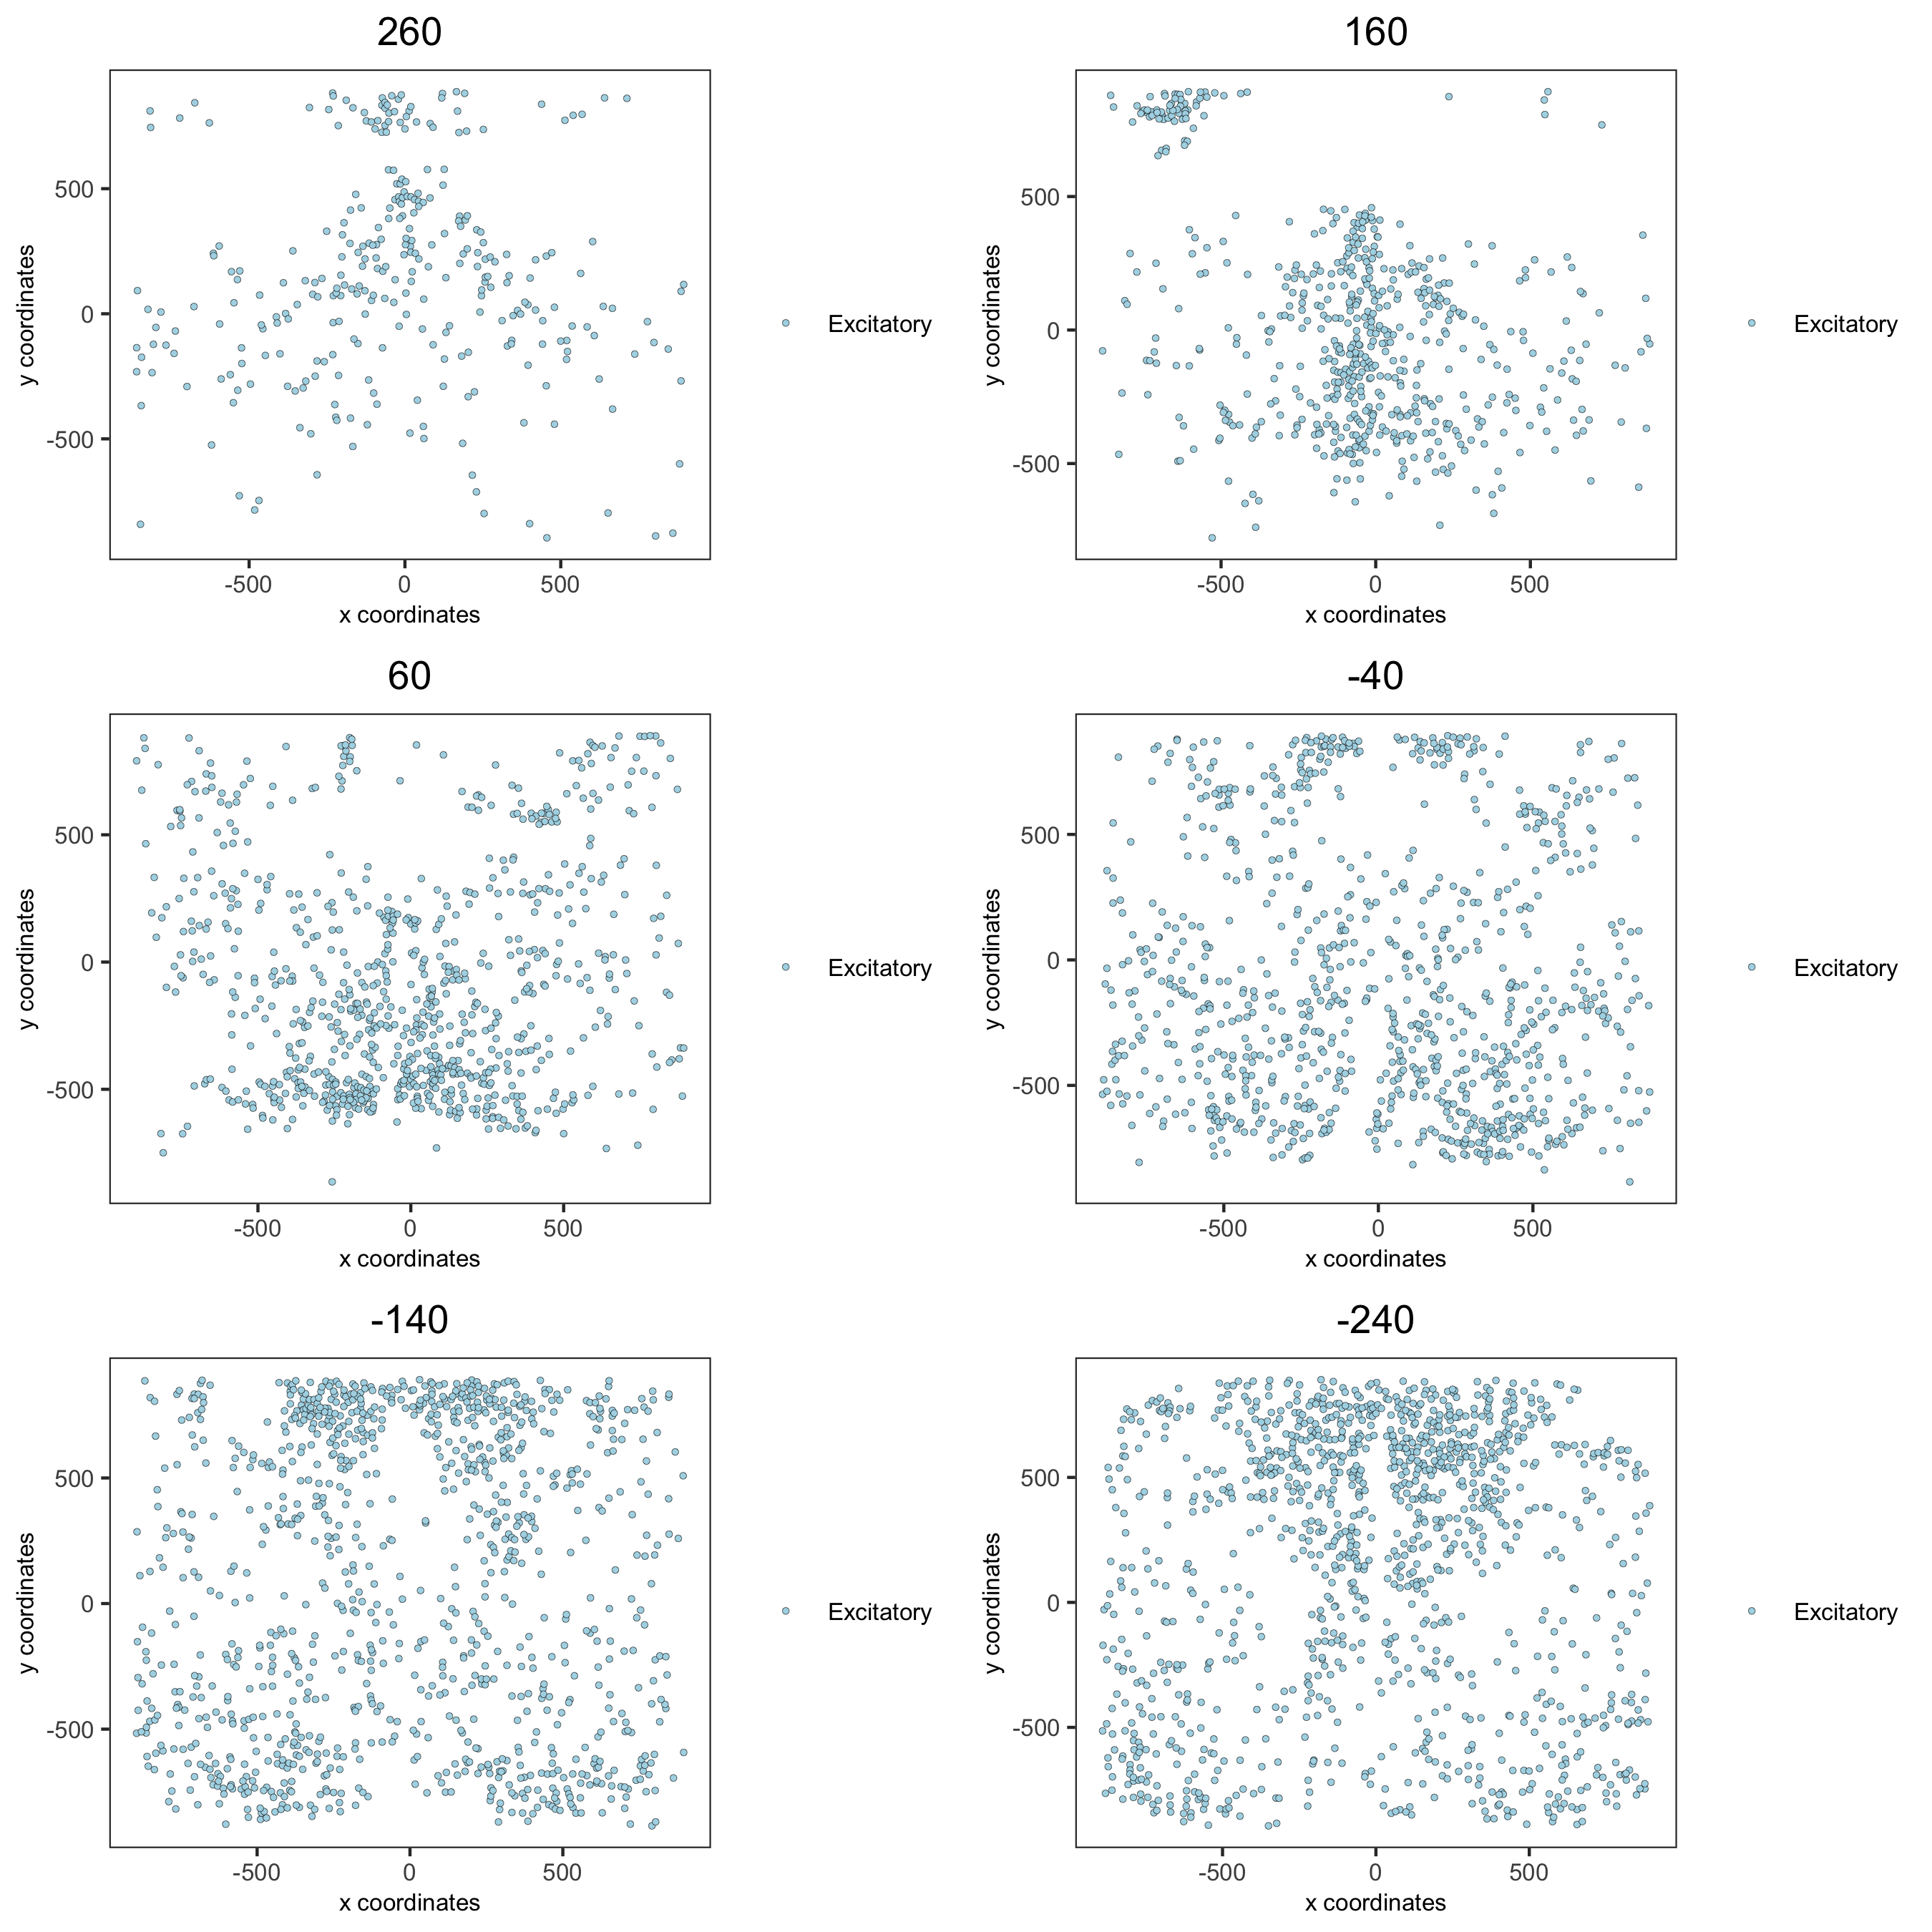
spatPlot2D(gobject = merFISH_test, point_size = 1.0,
    cell_color = 'cell_types', cell_color_code = mycolorcode,
    select_cell_groups = 'Excitatory', show_other_cells = F,
    group_by = 'layer_ID', cow_n_col = 2, group_by_subset = c(seq(260, -290, -100)),
    save_param = c(save_name = '7_g_spatPlot2D_cell_types_excit'))
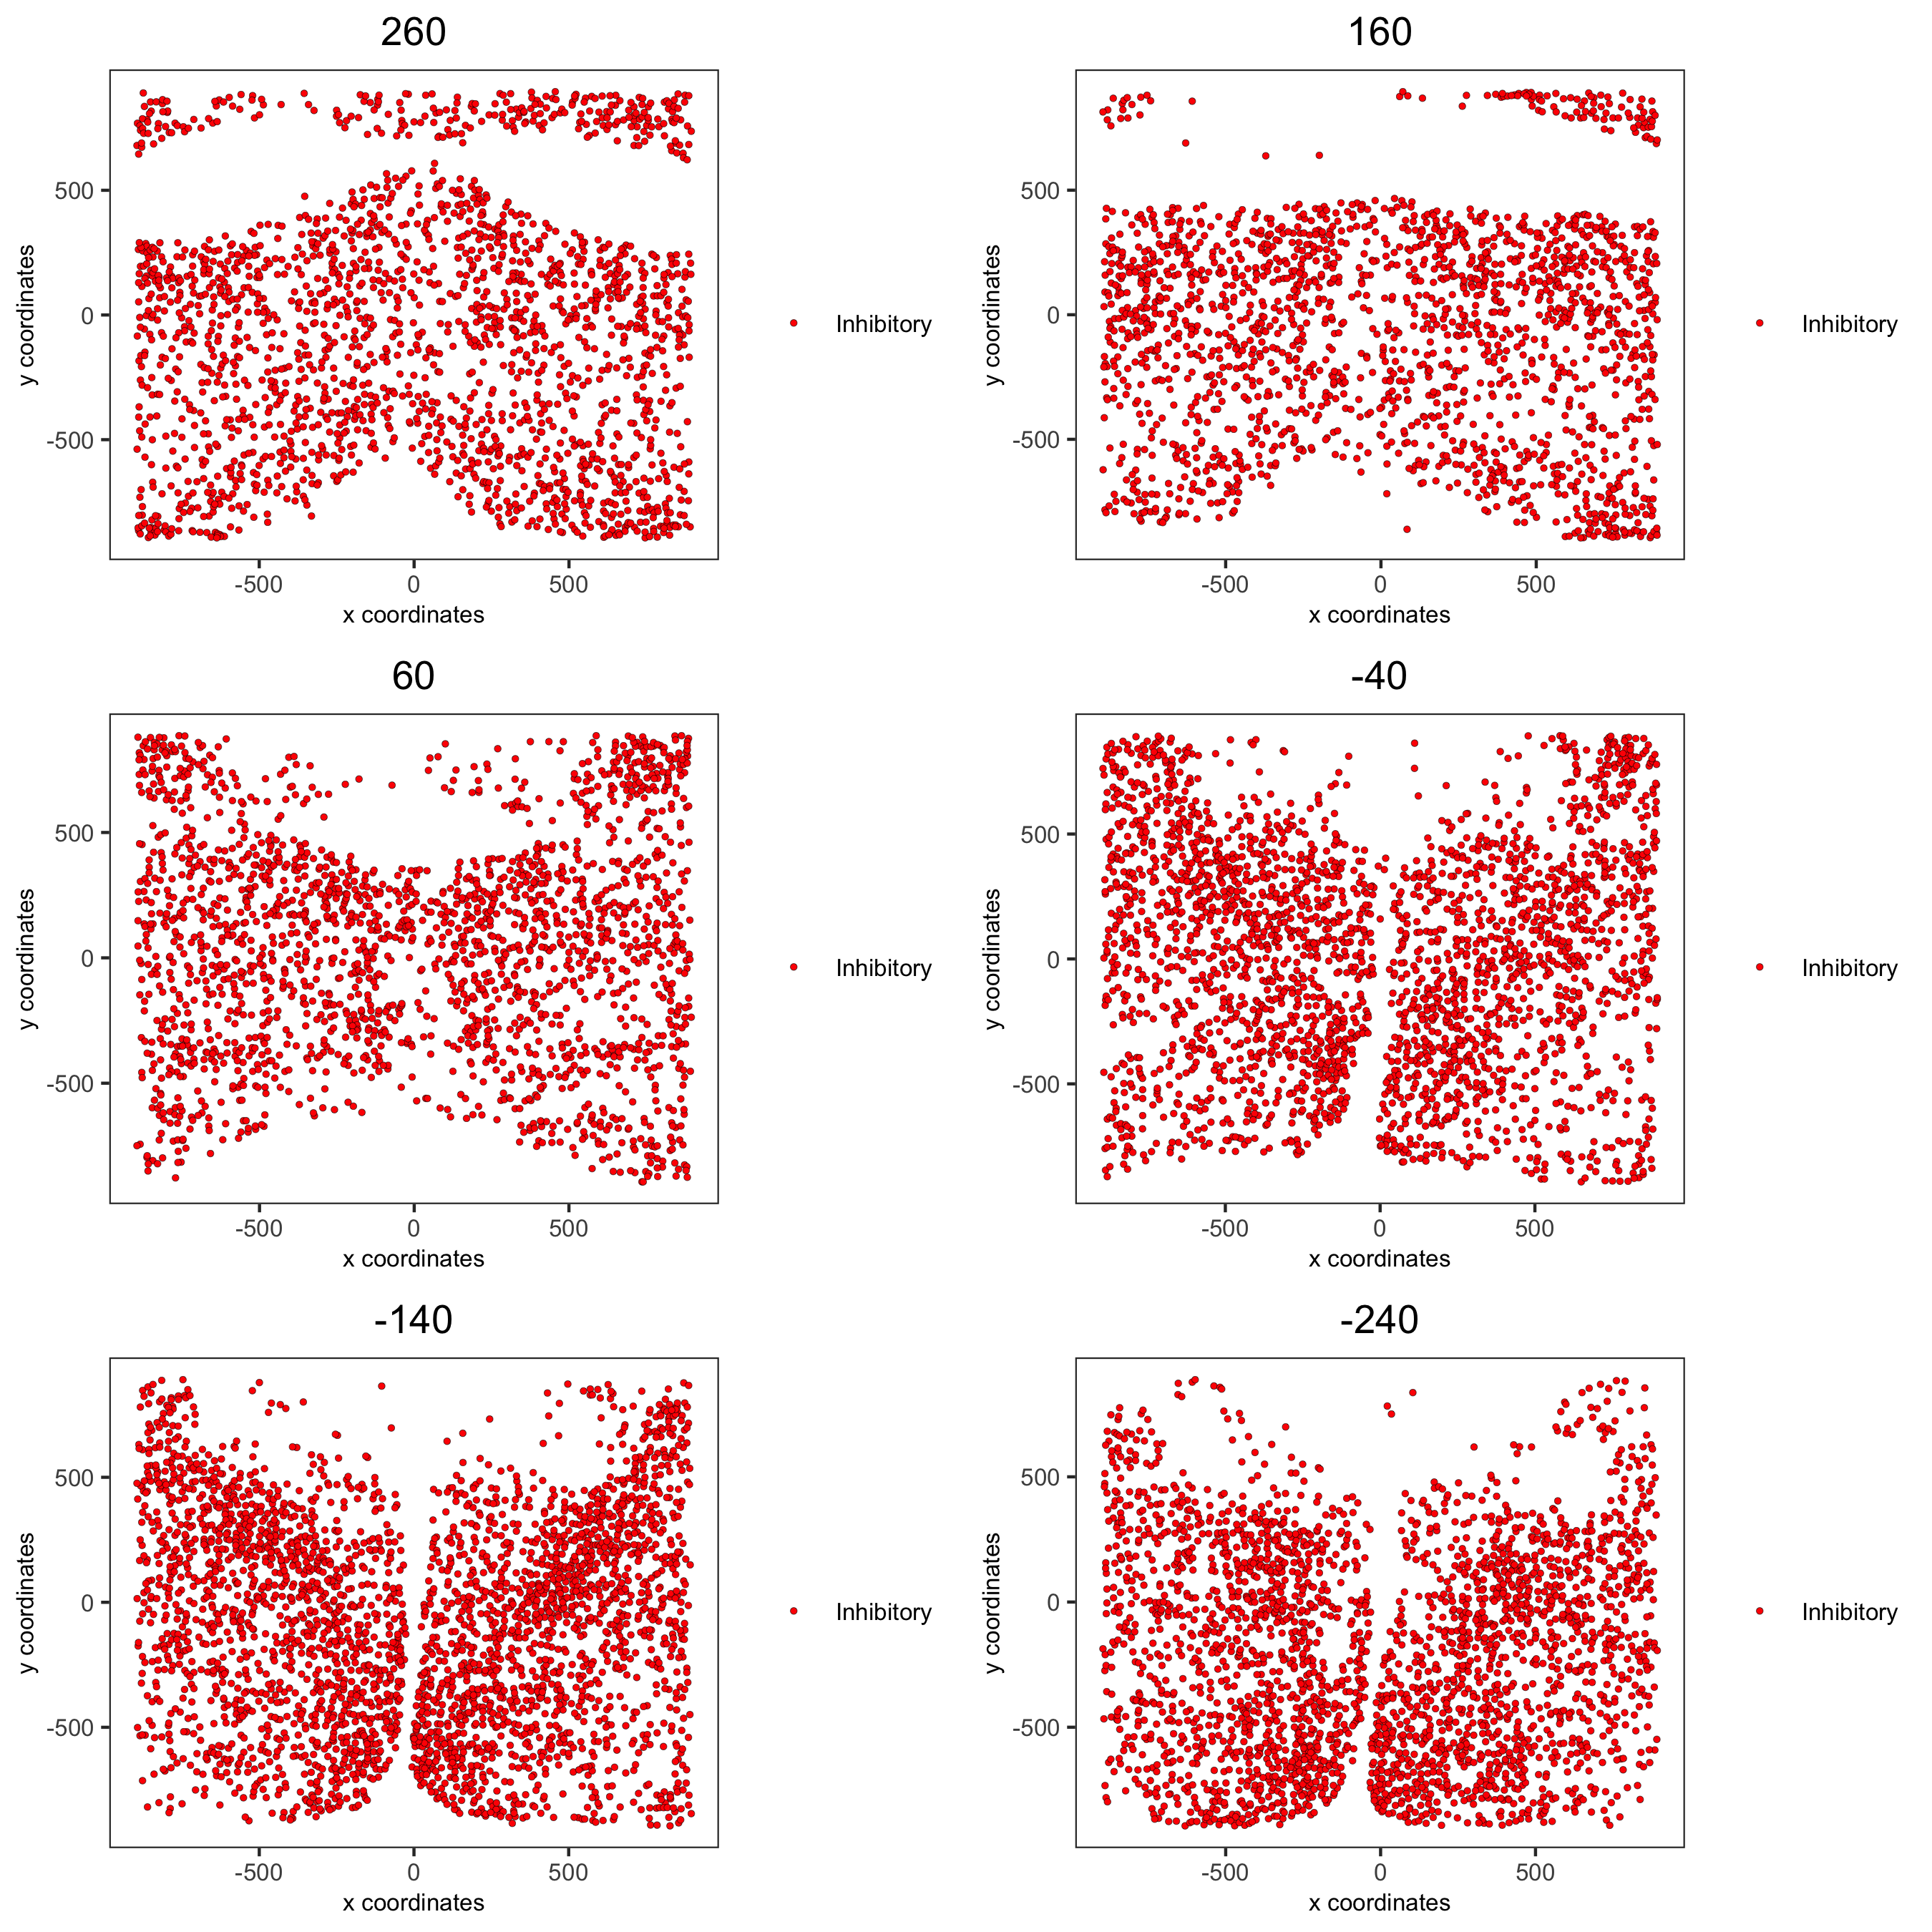
7.3 Inhibitory Cells Only
# inhibitory
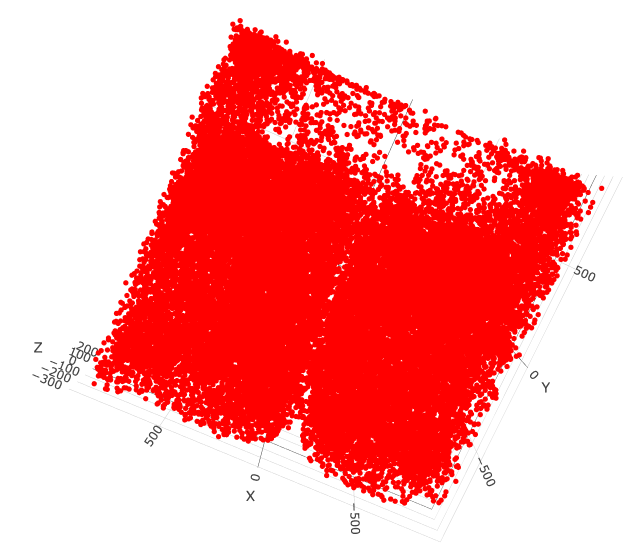
spatPlot3D(merFISH_test,
cell_color = 'cell_types', axis_scale = 'real',
sdimx = 'sdimx', sdimy = 'sdimy', sdimz = 'sdimz',
show_grid = F, cell_color_code = mycolorcode,
select_cell_groups = 'Inhibitory', show_other_cells = F,
save_param = c(save_name = '7_h_spatPlot_cell_types_inhib'))
spatPlot2D(gobject = merFISH_test, point_size = 1.0,
    cell_color = 'cell_types', cell_color_code = mycolorcode,
    select_cell_groups = 'Inhibitory', show_other_cells = F,
    group_by = 'layer_ID', cow_n_col = 2, group_by_subset = c(seq(260, -290, -100)),
    save_param = c(save_name = '7_i_spatPlot2D_cell_types_inhib'))
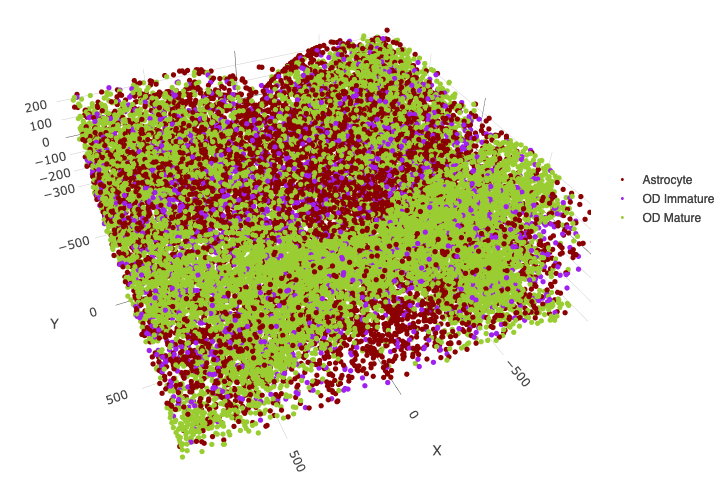
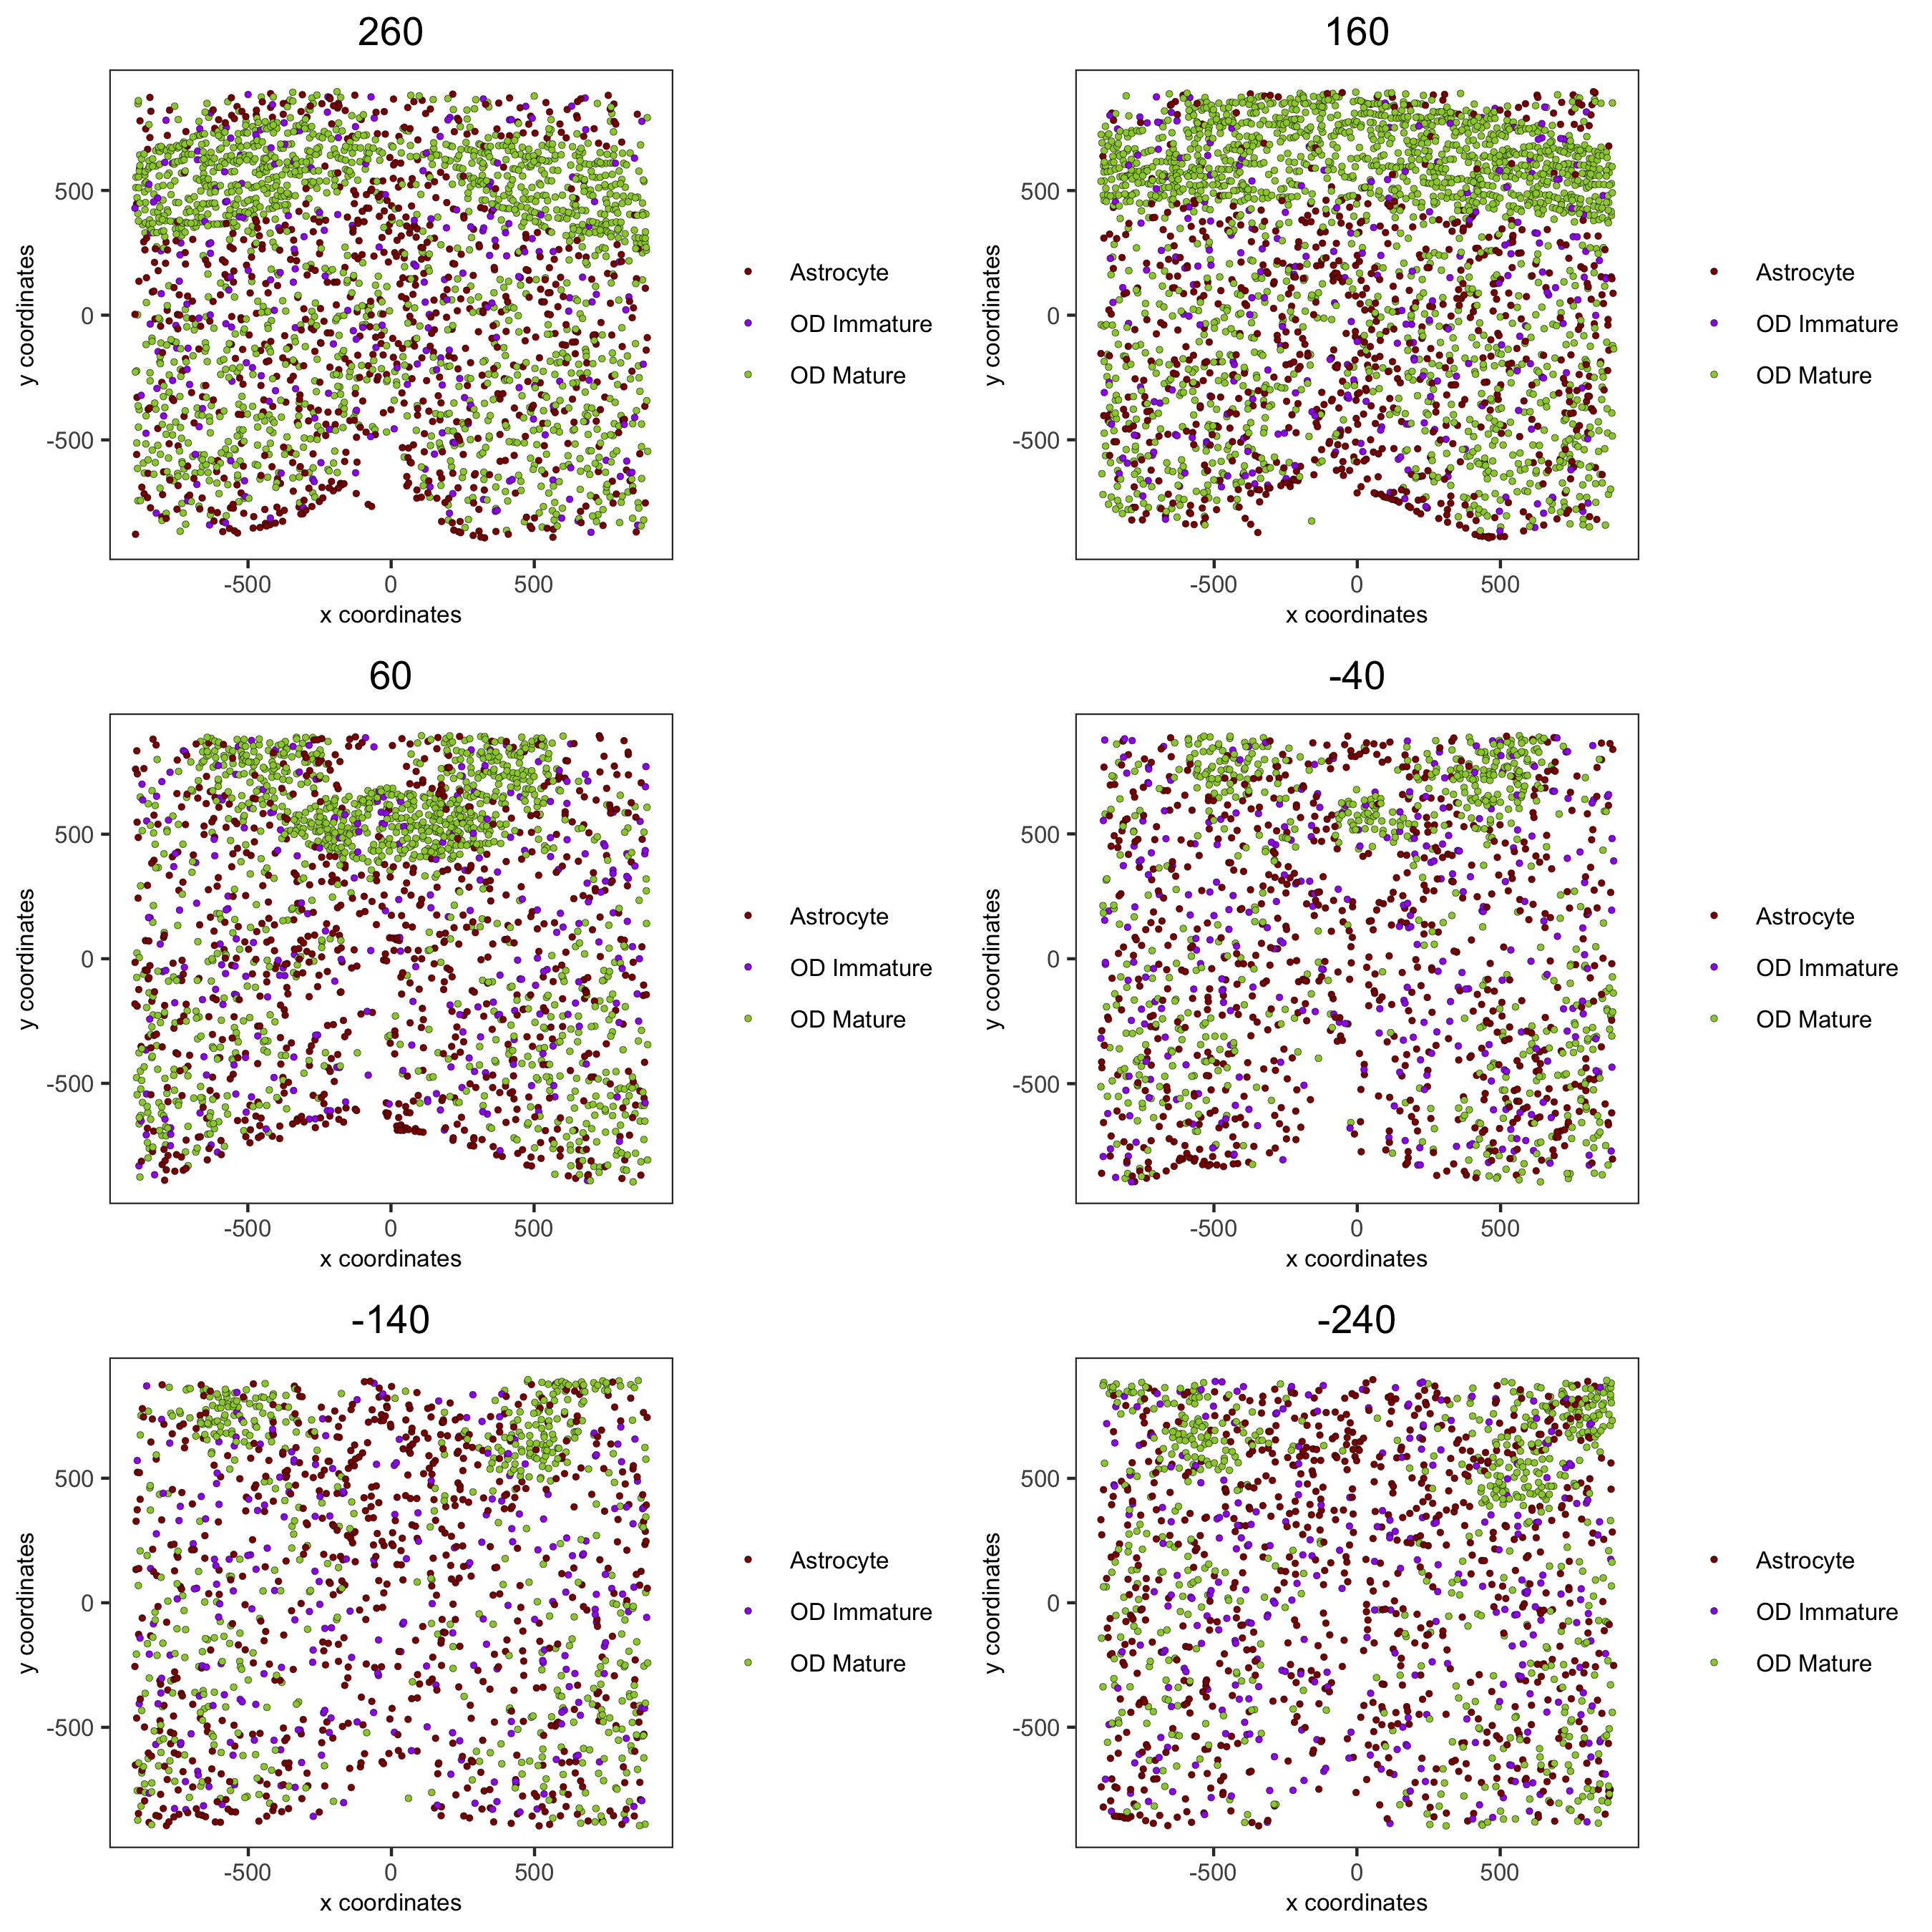
7.4 OD and Astrocytes Only
spatPlot3D(merFISH_test,
    cell_color = 'cell_types', axis_scale = 'real',
    sdimx = 'sdimx', sdimy = 'sdimy', sdimz = 'sdimz',
    show_grid = F, cell_color_code = mycolorcode,
    select_cell_groups = c('Astrocyte', 'OD Mature', 'OD Immature'), show_other_cells = F,
    save_param = c(save_name = '7_j_spatPlot_cell_types_ODandAstro'))
spatPlot2D(gobject = merFISH_test, point_size = 1.0,
    cell_color = 'cell_types', cell_color_code = mycolorcode,
    select_cell_groups = c('Astrocyte', 'OD Mature', 'OD Immature'), show_other_cells = F,
    group_by = 'layer_ID', cow_n_col = 2, group_by_subset = c(seq(260, -290, -100)),
    save_param = c(save_name = '7_k_spatPlot2D_cell_types_ODandAstro'))
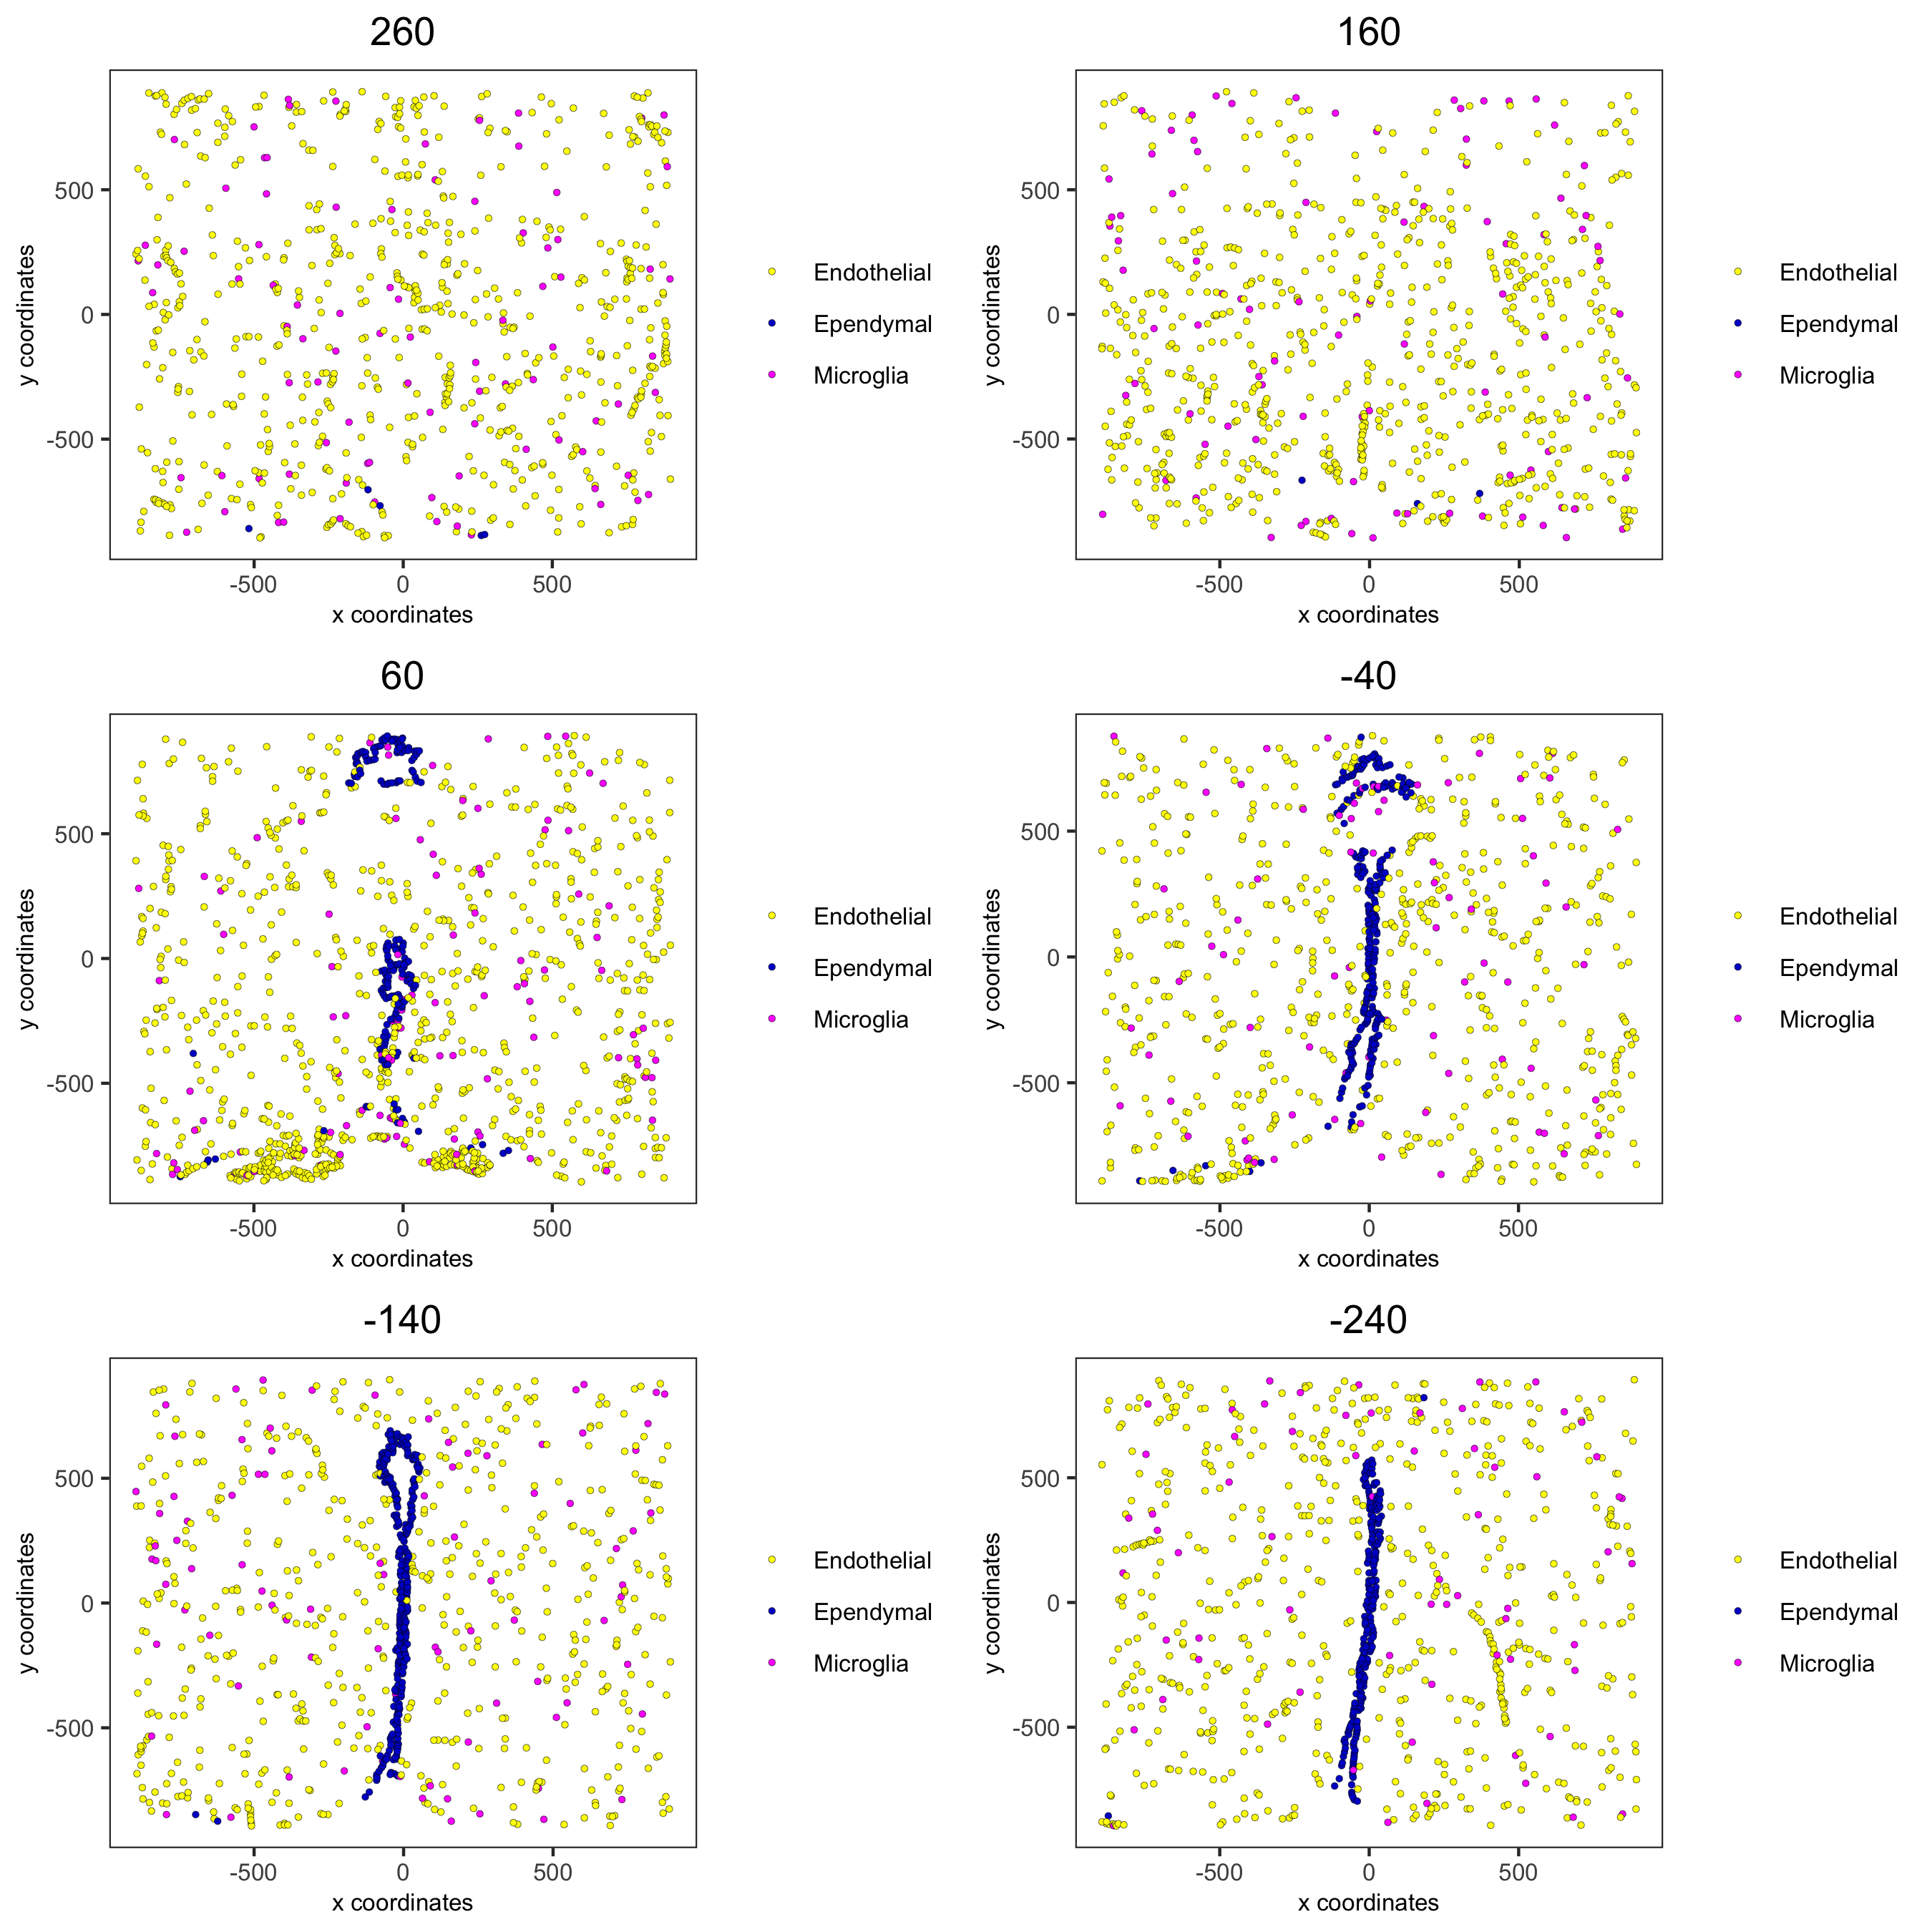
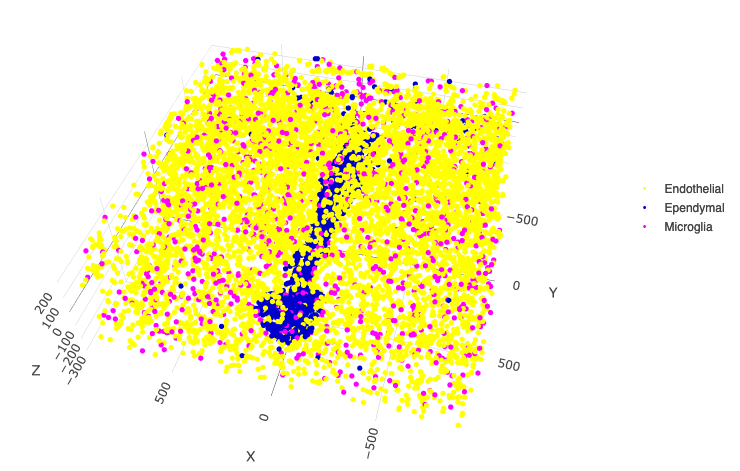
7.5 Other Cells Only
spatPlot3D(merFISH_test,
    cell_color = 'cell_types', axis_scale = 'real',
    sdimx = 'sdimx', sdimy = 'sdimy', sdimz = 'sdimz',
    show_grid = F, cell_color_code = mycolorcode,
    select_cell_groups = c('Microglia', 'Ependymal', 'Endothelial'), show_other_cells = F,
    save_param = c(save_name = '7_l_spatPlot_cell_types_other'))
spatPlot2D(gobject = merFISH_test, point_size = 1.0,
    cell_color = 'cell_types', cell_color_code = mycolorcode,
    select_cell_groups = c('Microglia', 'Ependymal', 'Endothelial'), show_other_cells = F,
    group_by = 'layer_ID', cow_n_col = 2, group_by_subset = c(seq(260, -290, -100)),
    save_param = c(save_name = '7_m_spatPlot2D_cell_types_other'))