How to Subset a Giotto Object?
There are several ways to subset a Giotto object or visualize a subset of the data. Below are some subsetting examples.
Note
Figures may not be identical, because examples might have been updated, but the subsetting principles remain the same.
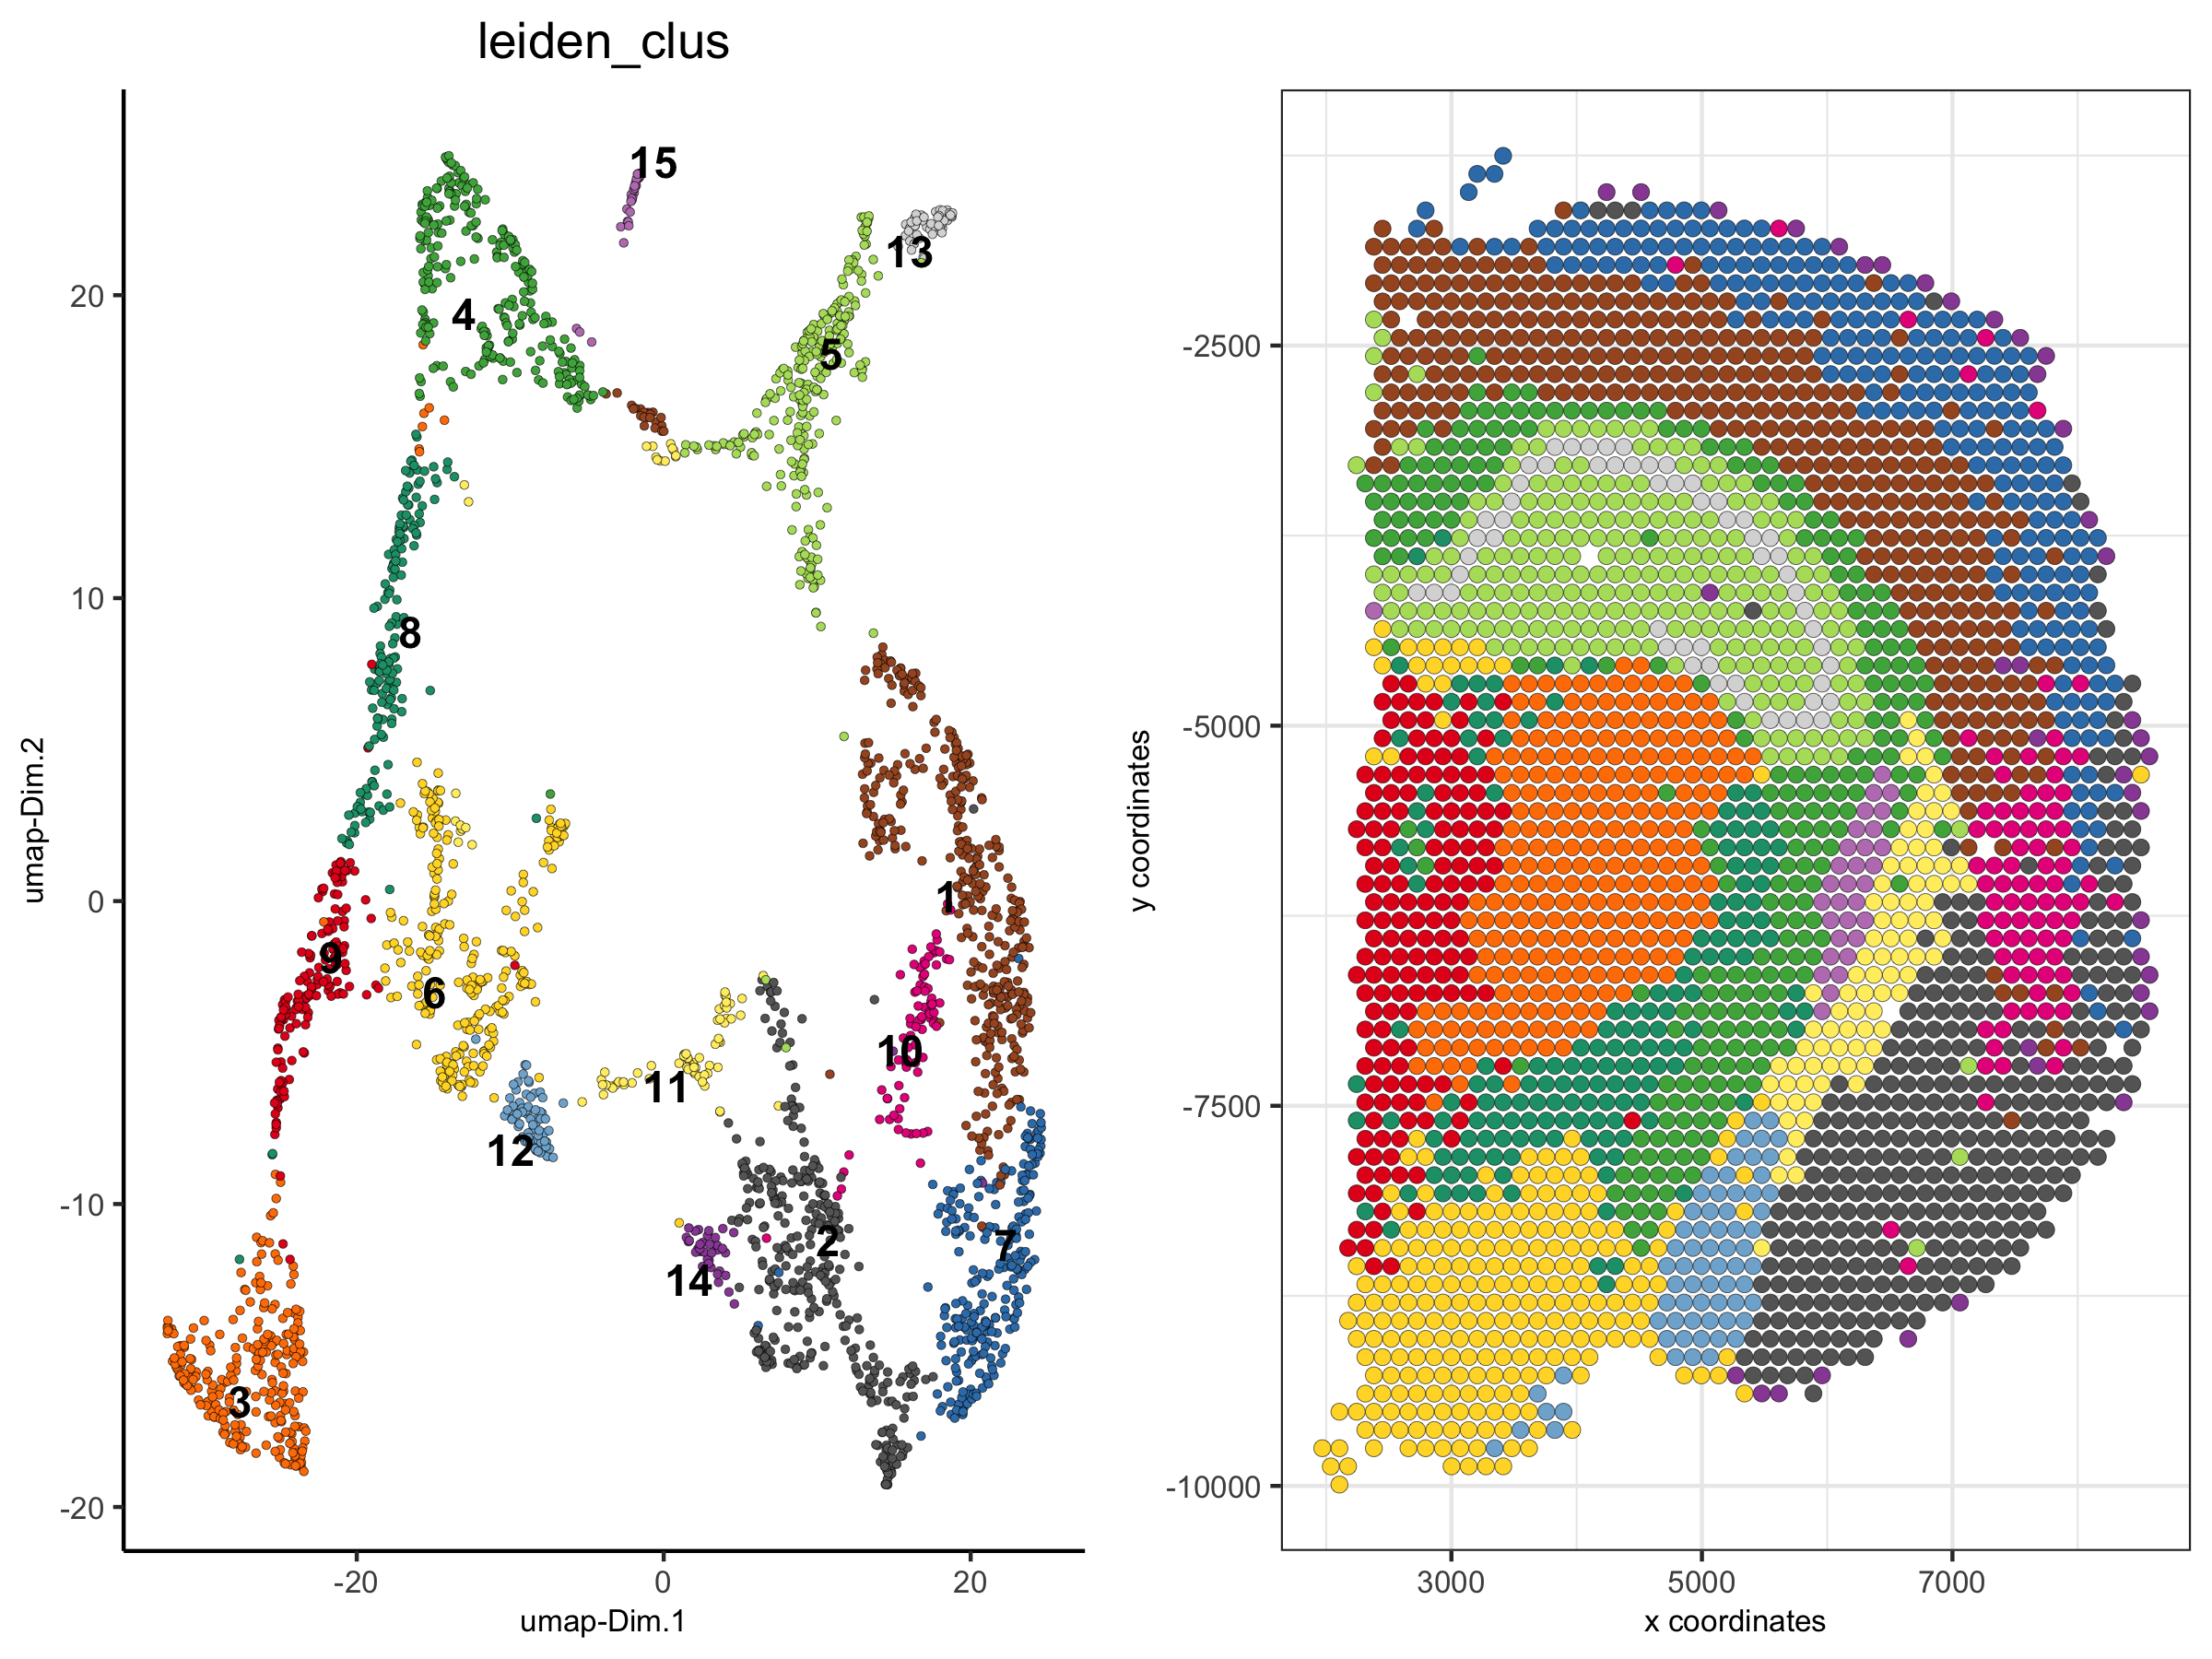
1. The Visium 10X Whole Brain
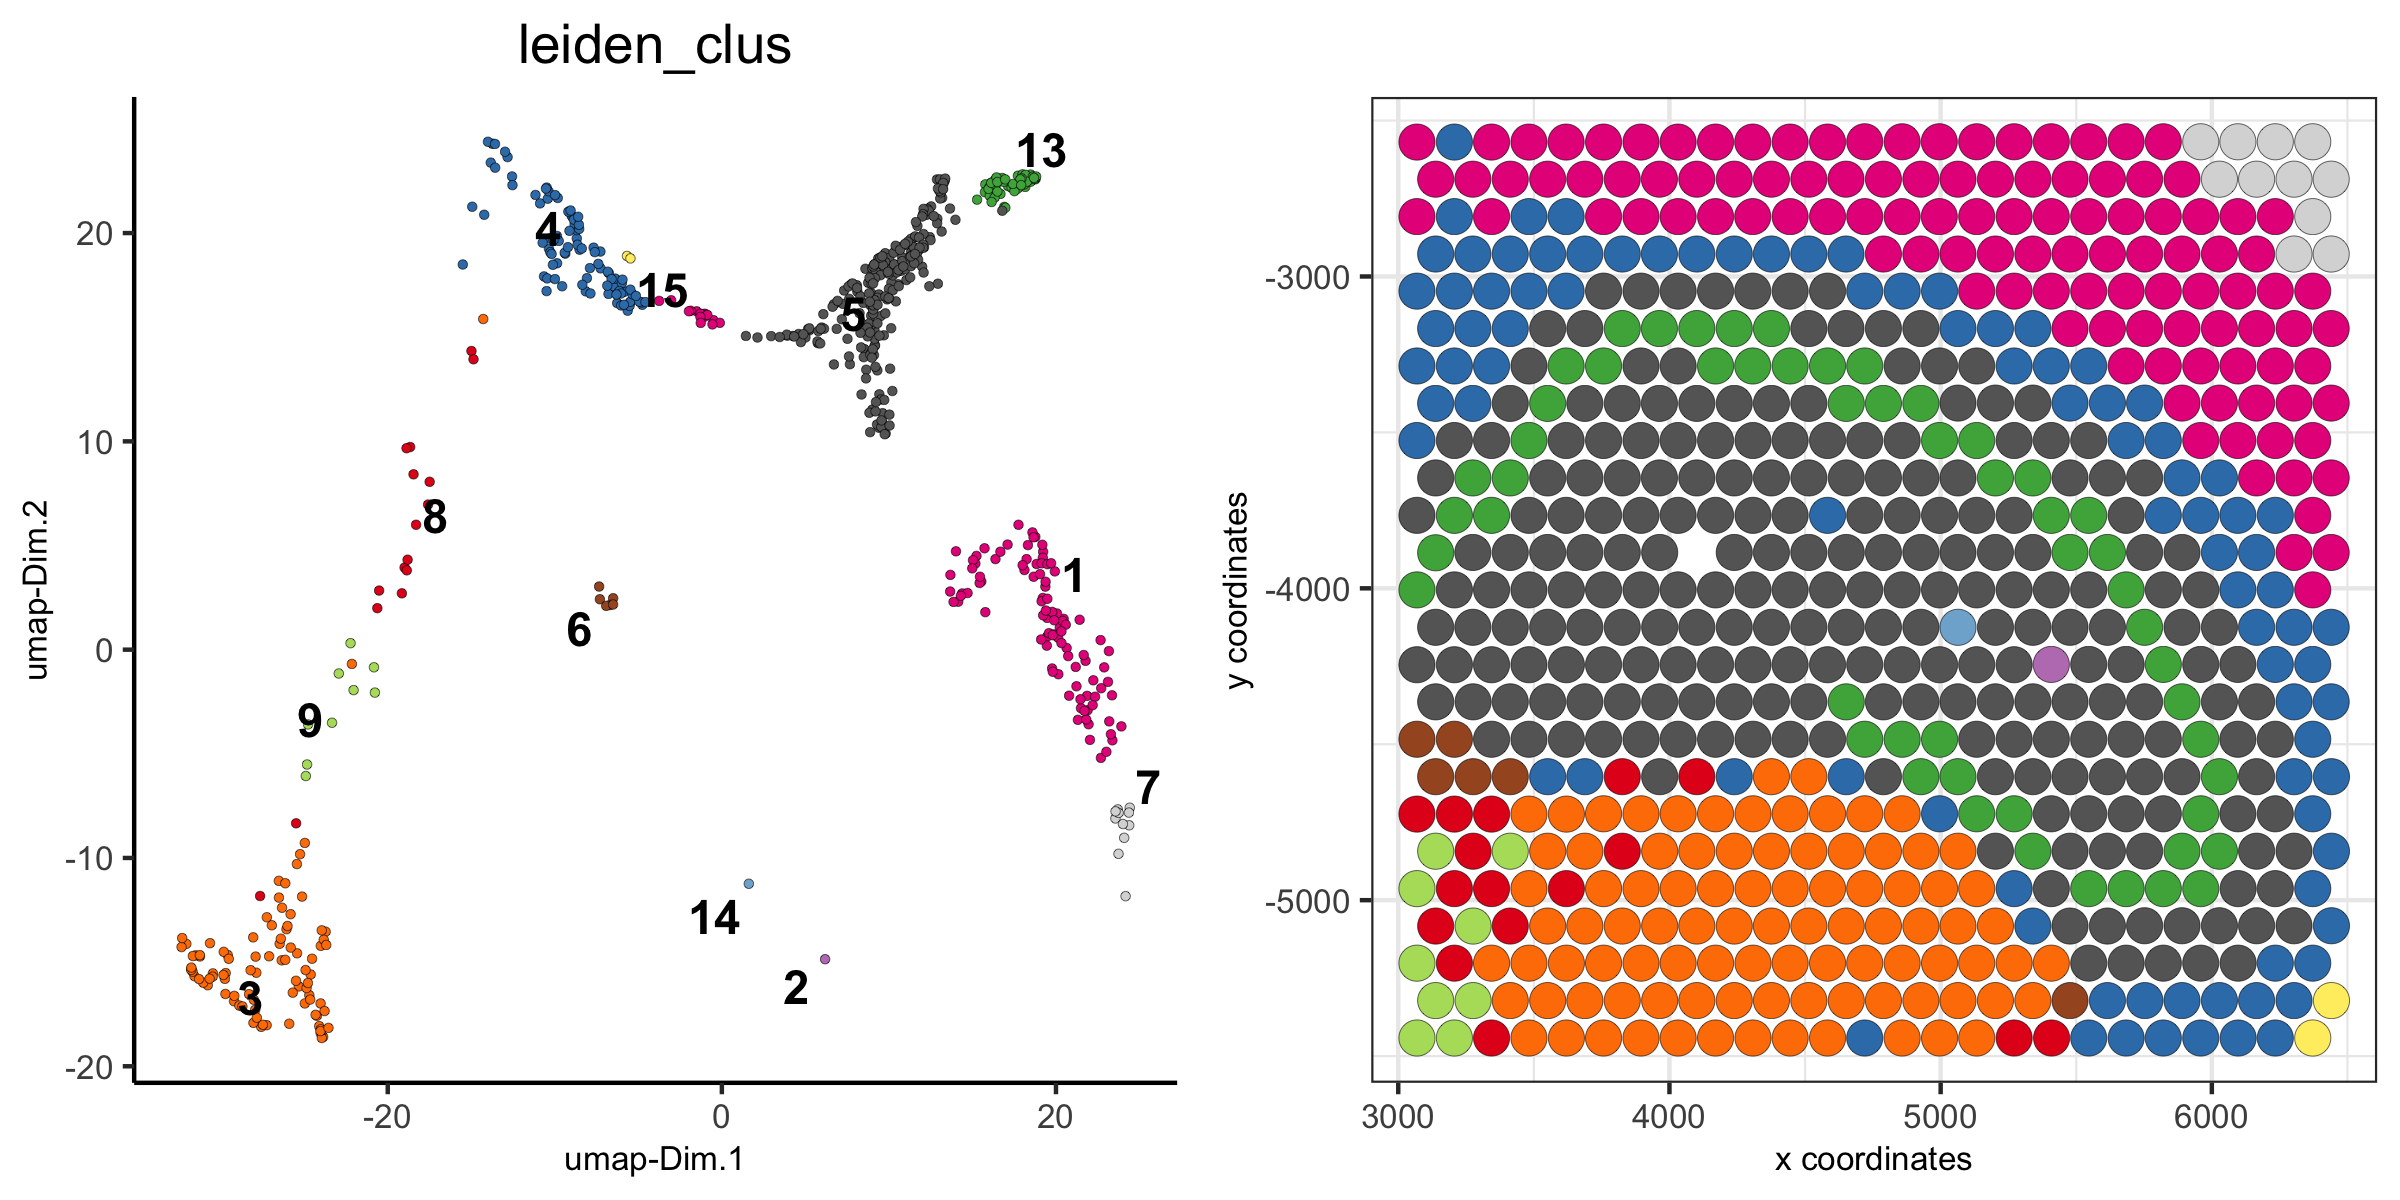
spatDimPlot(visium_brain, cell_color = 'leiden_clus',
plot_alignment = 'horizontal', spat_point_size = 2)
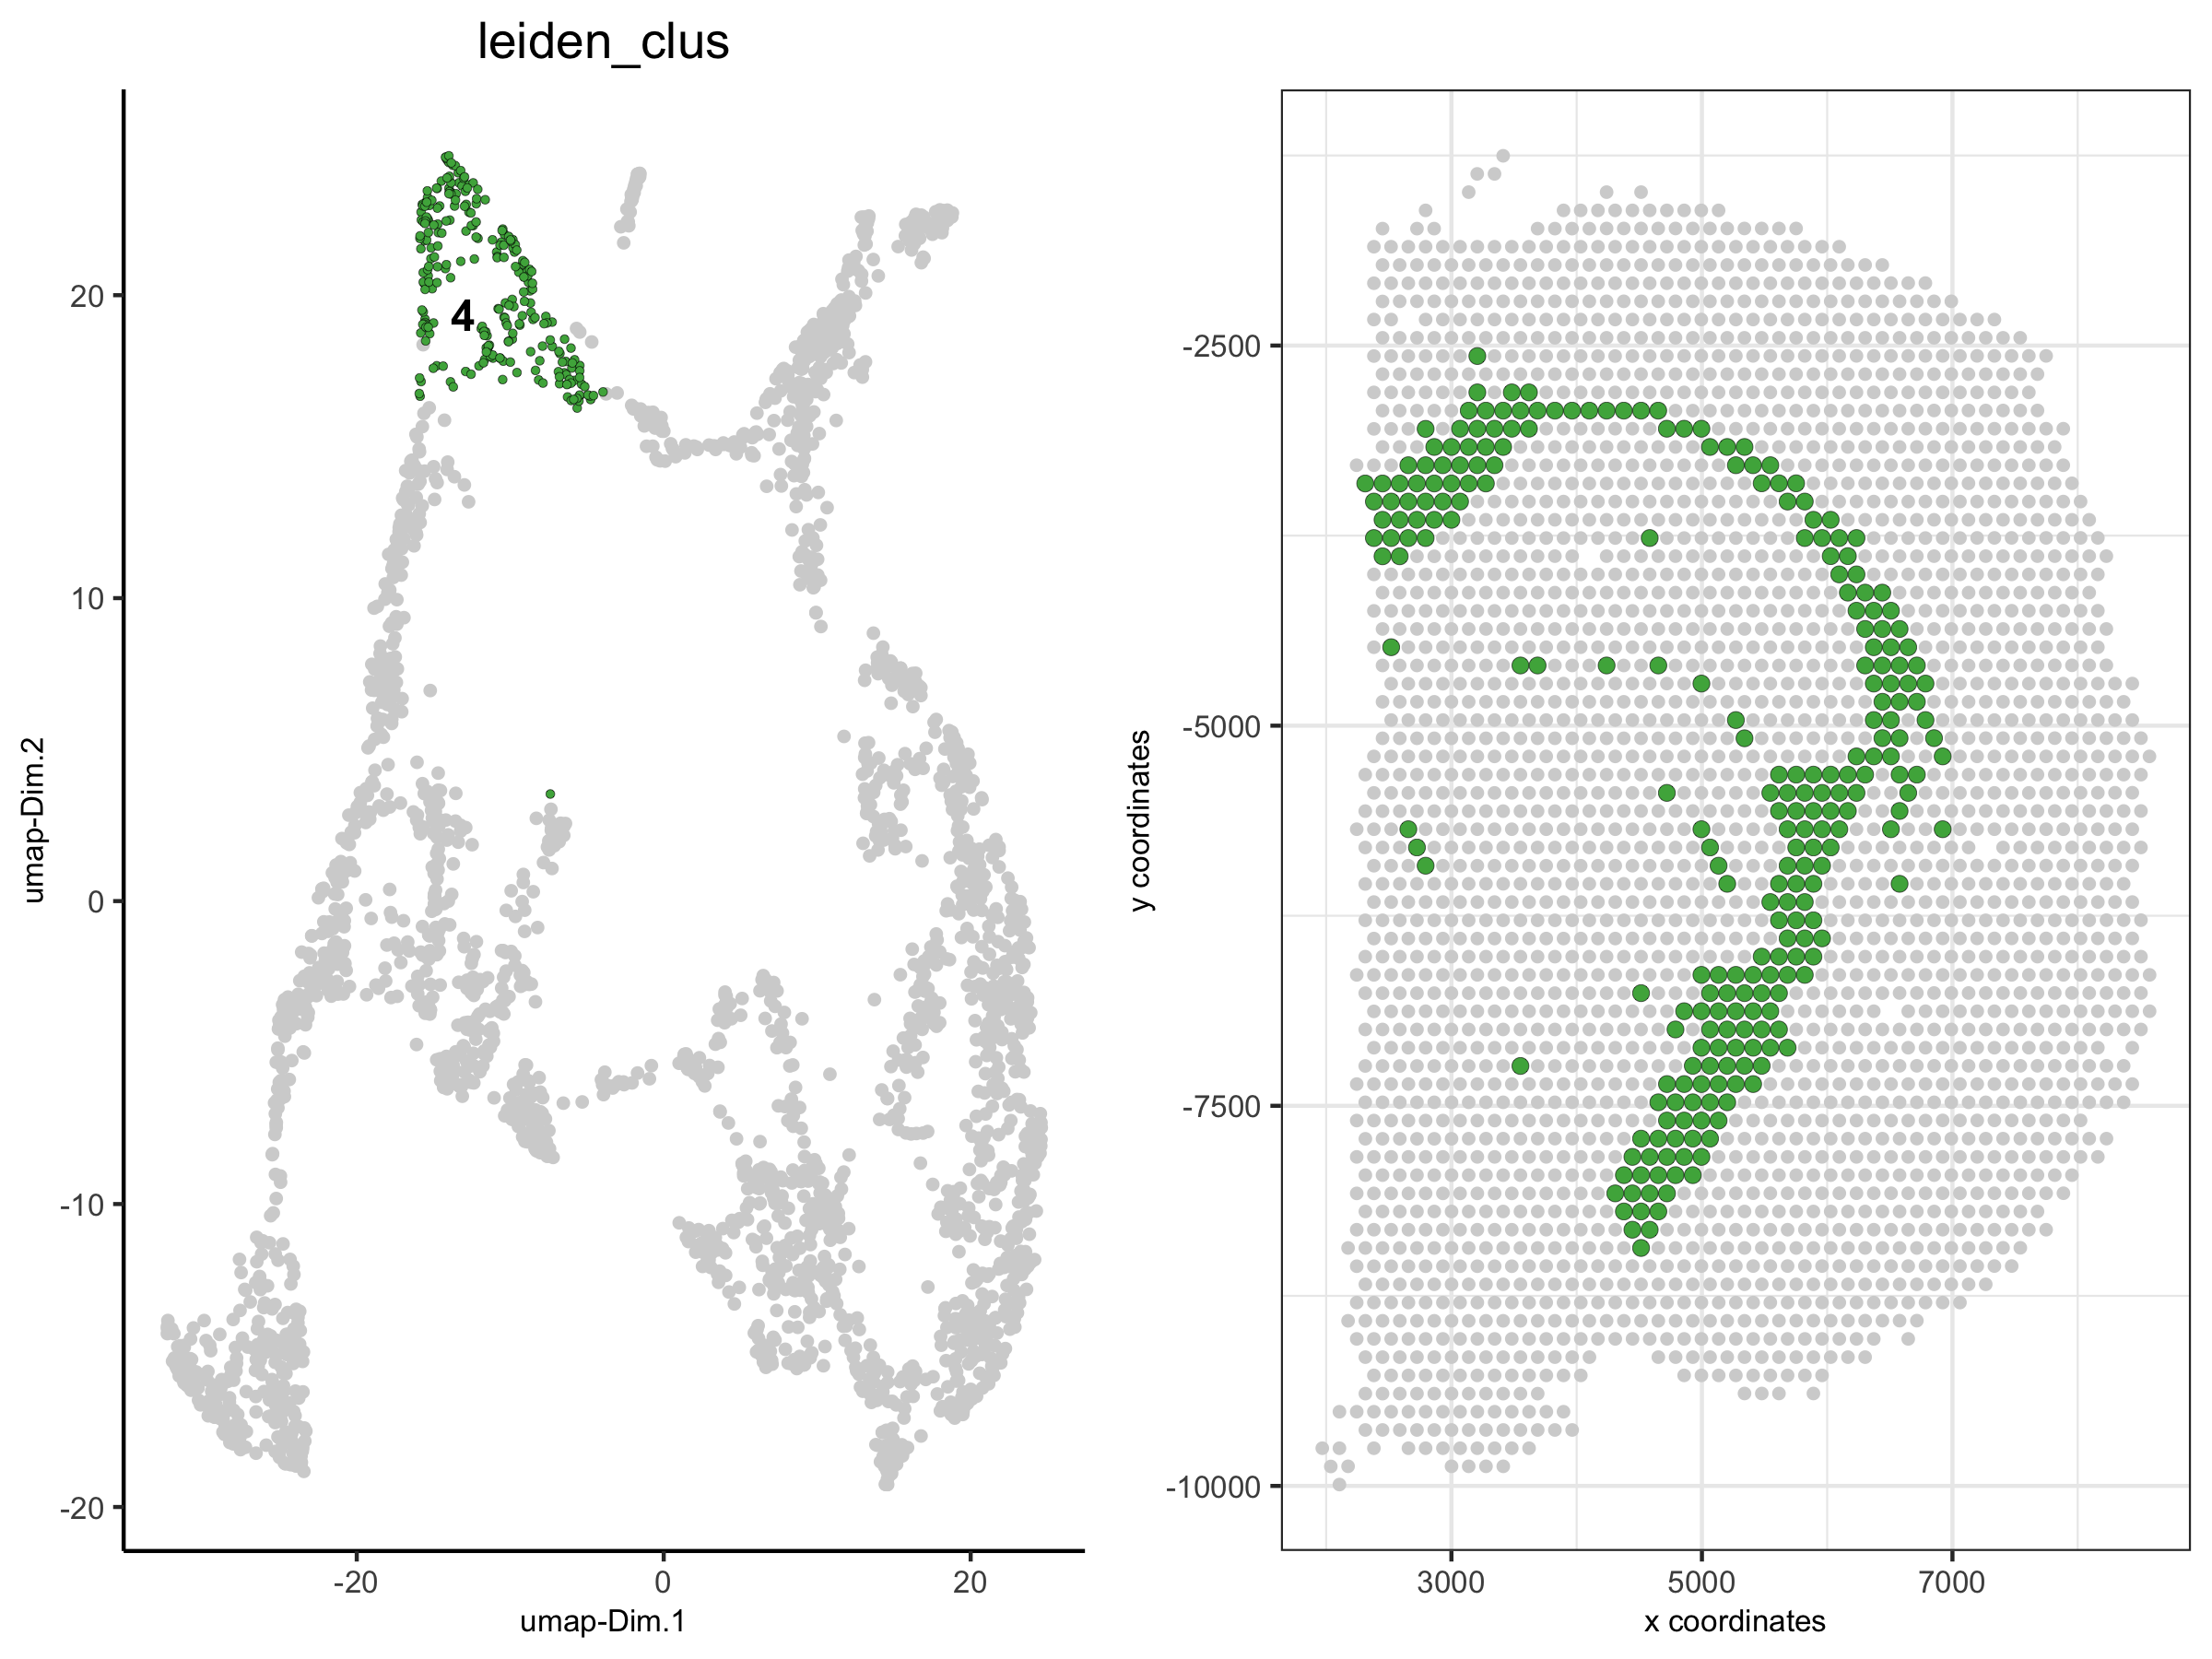
2. Show Only A Subset of Clusters
spatDimPlot(visium_brain,
    cell_color = 'leiden_clus',  select_cell_groups = '4',
    plot_alignment = 'horizontal', spat_point_size = 2)
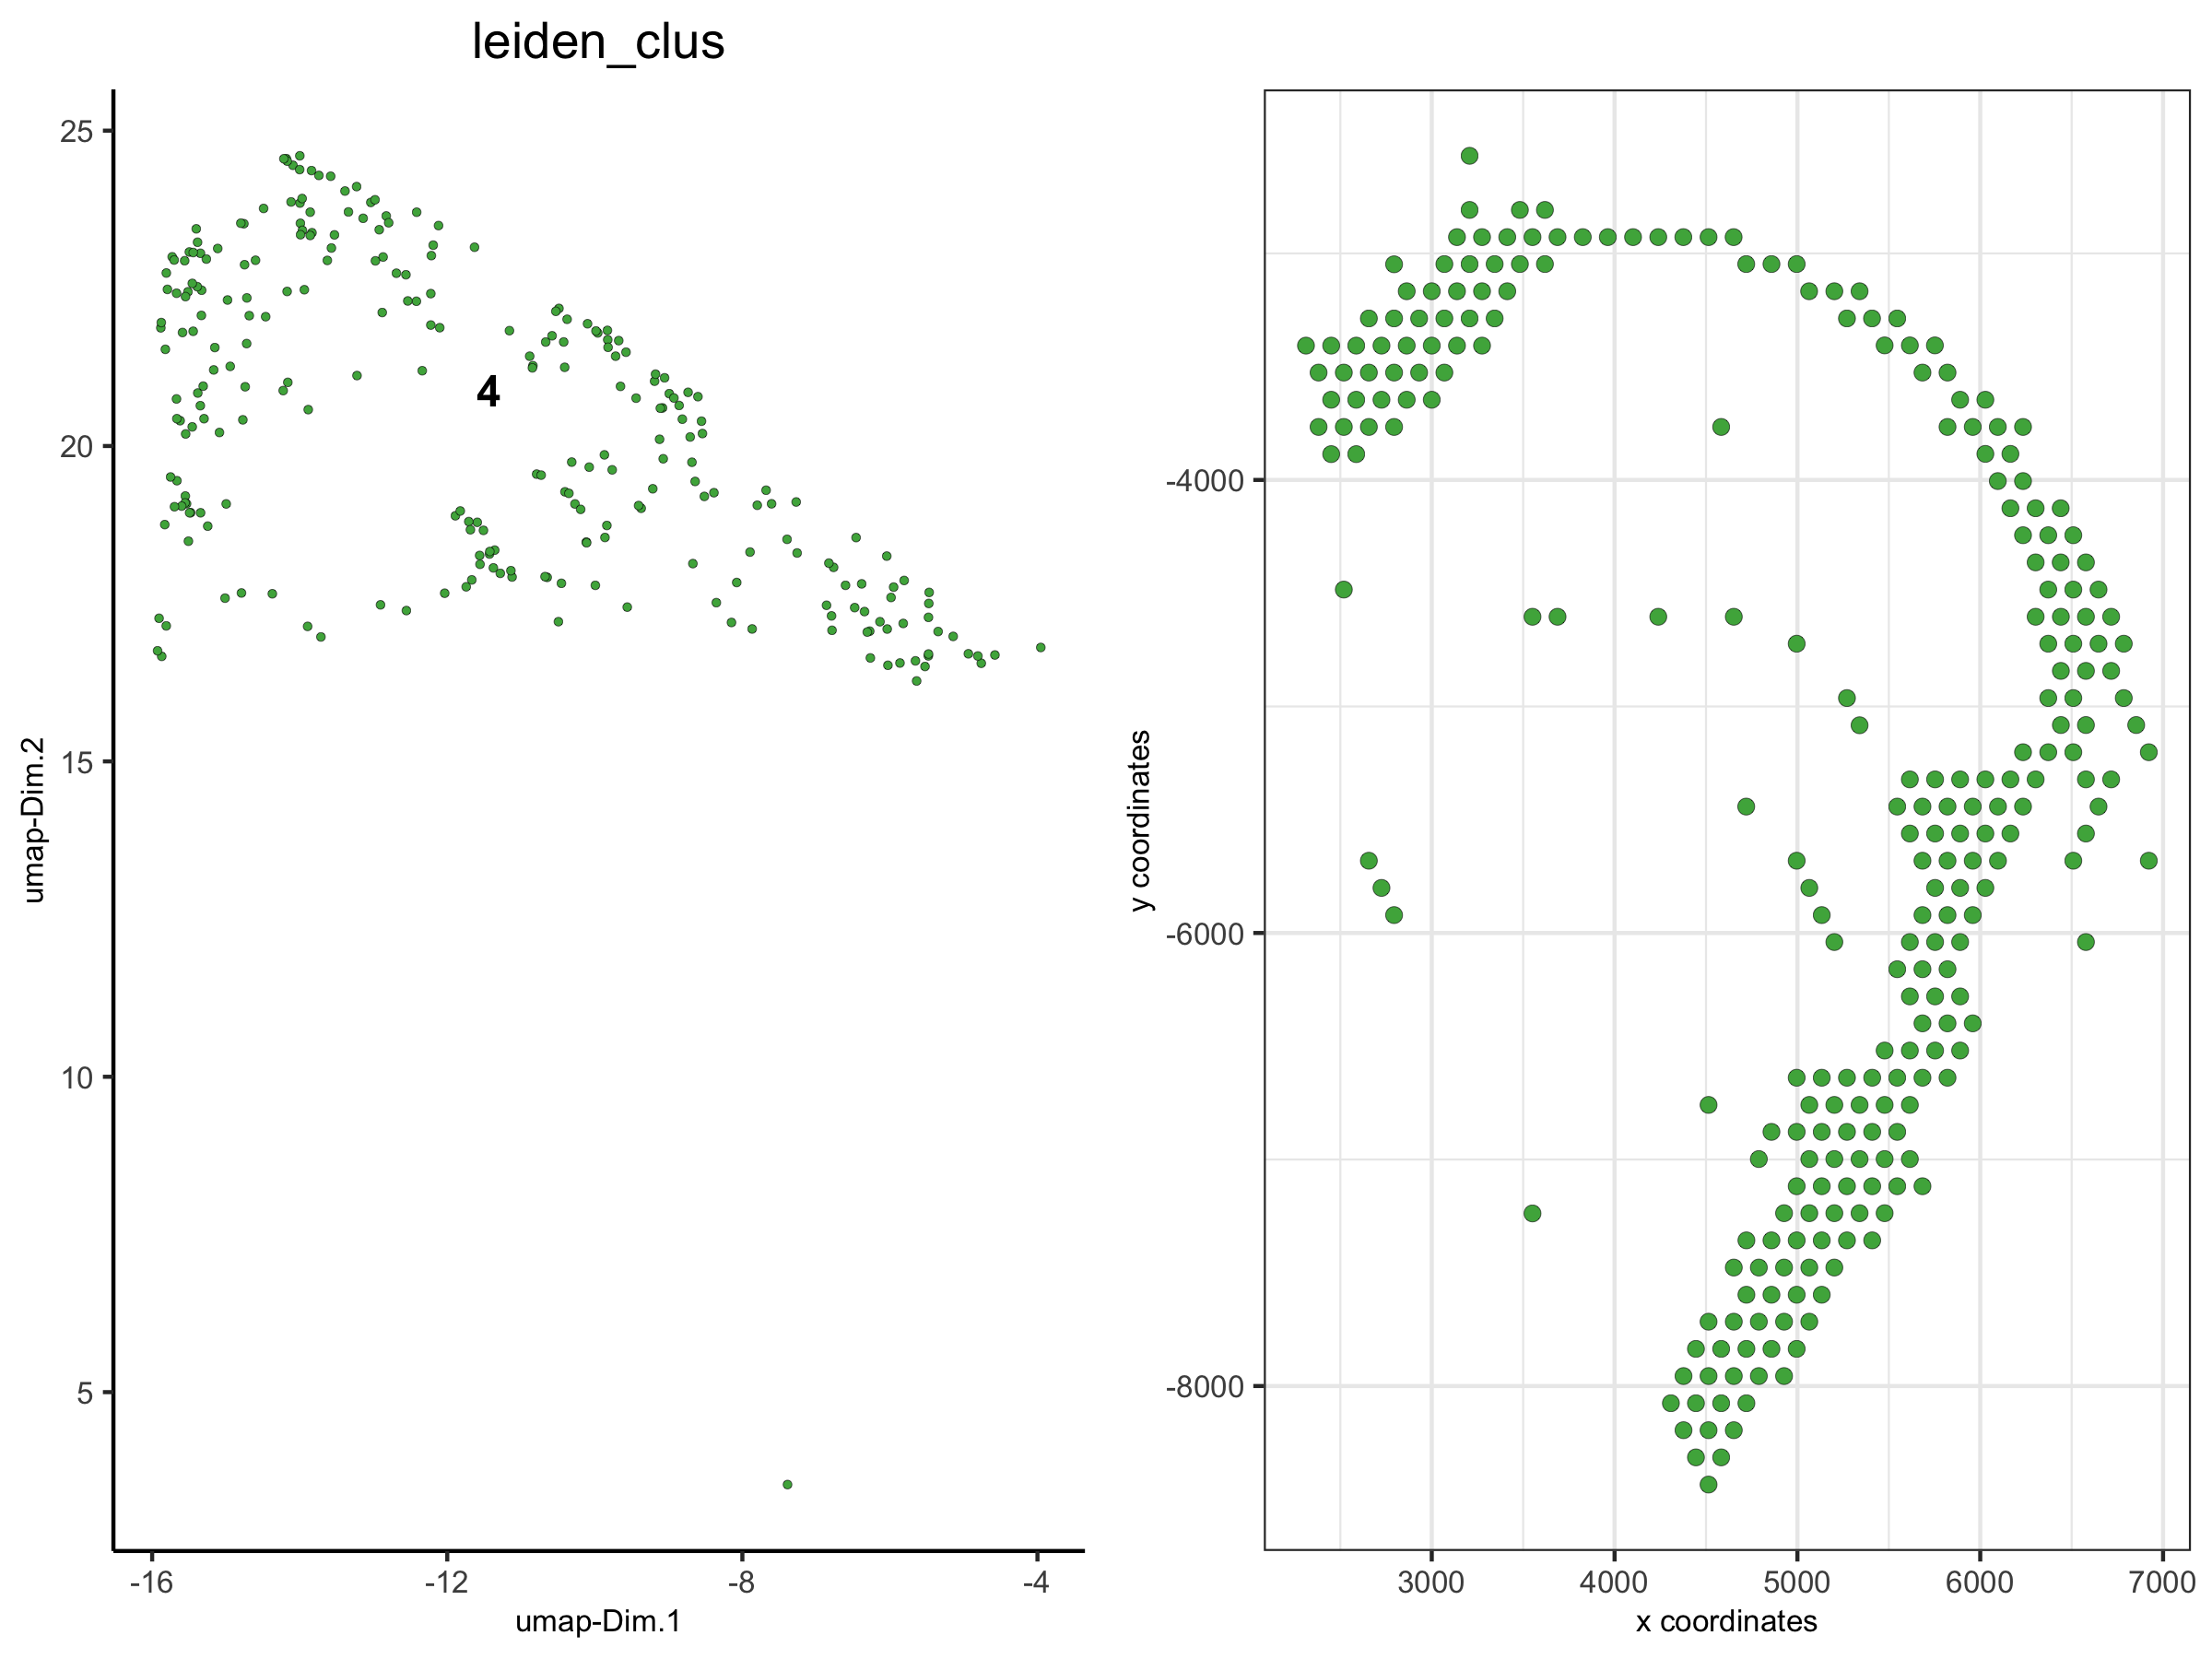
3. Show Only A Subset of Clusters (excluding not selected cells)
spatDimPlot(visium_brain,
    cell_color = 'leiden_clus',  select_cell_groups = '4', show_other_cells = F,
    plot_alignment = 'horizontal', spat_point_size = 2)
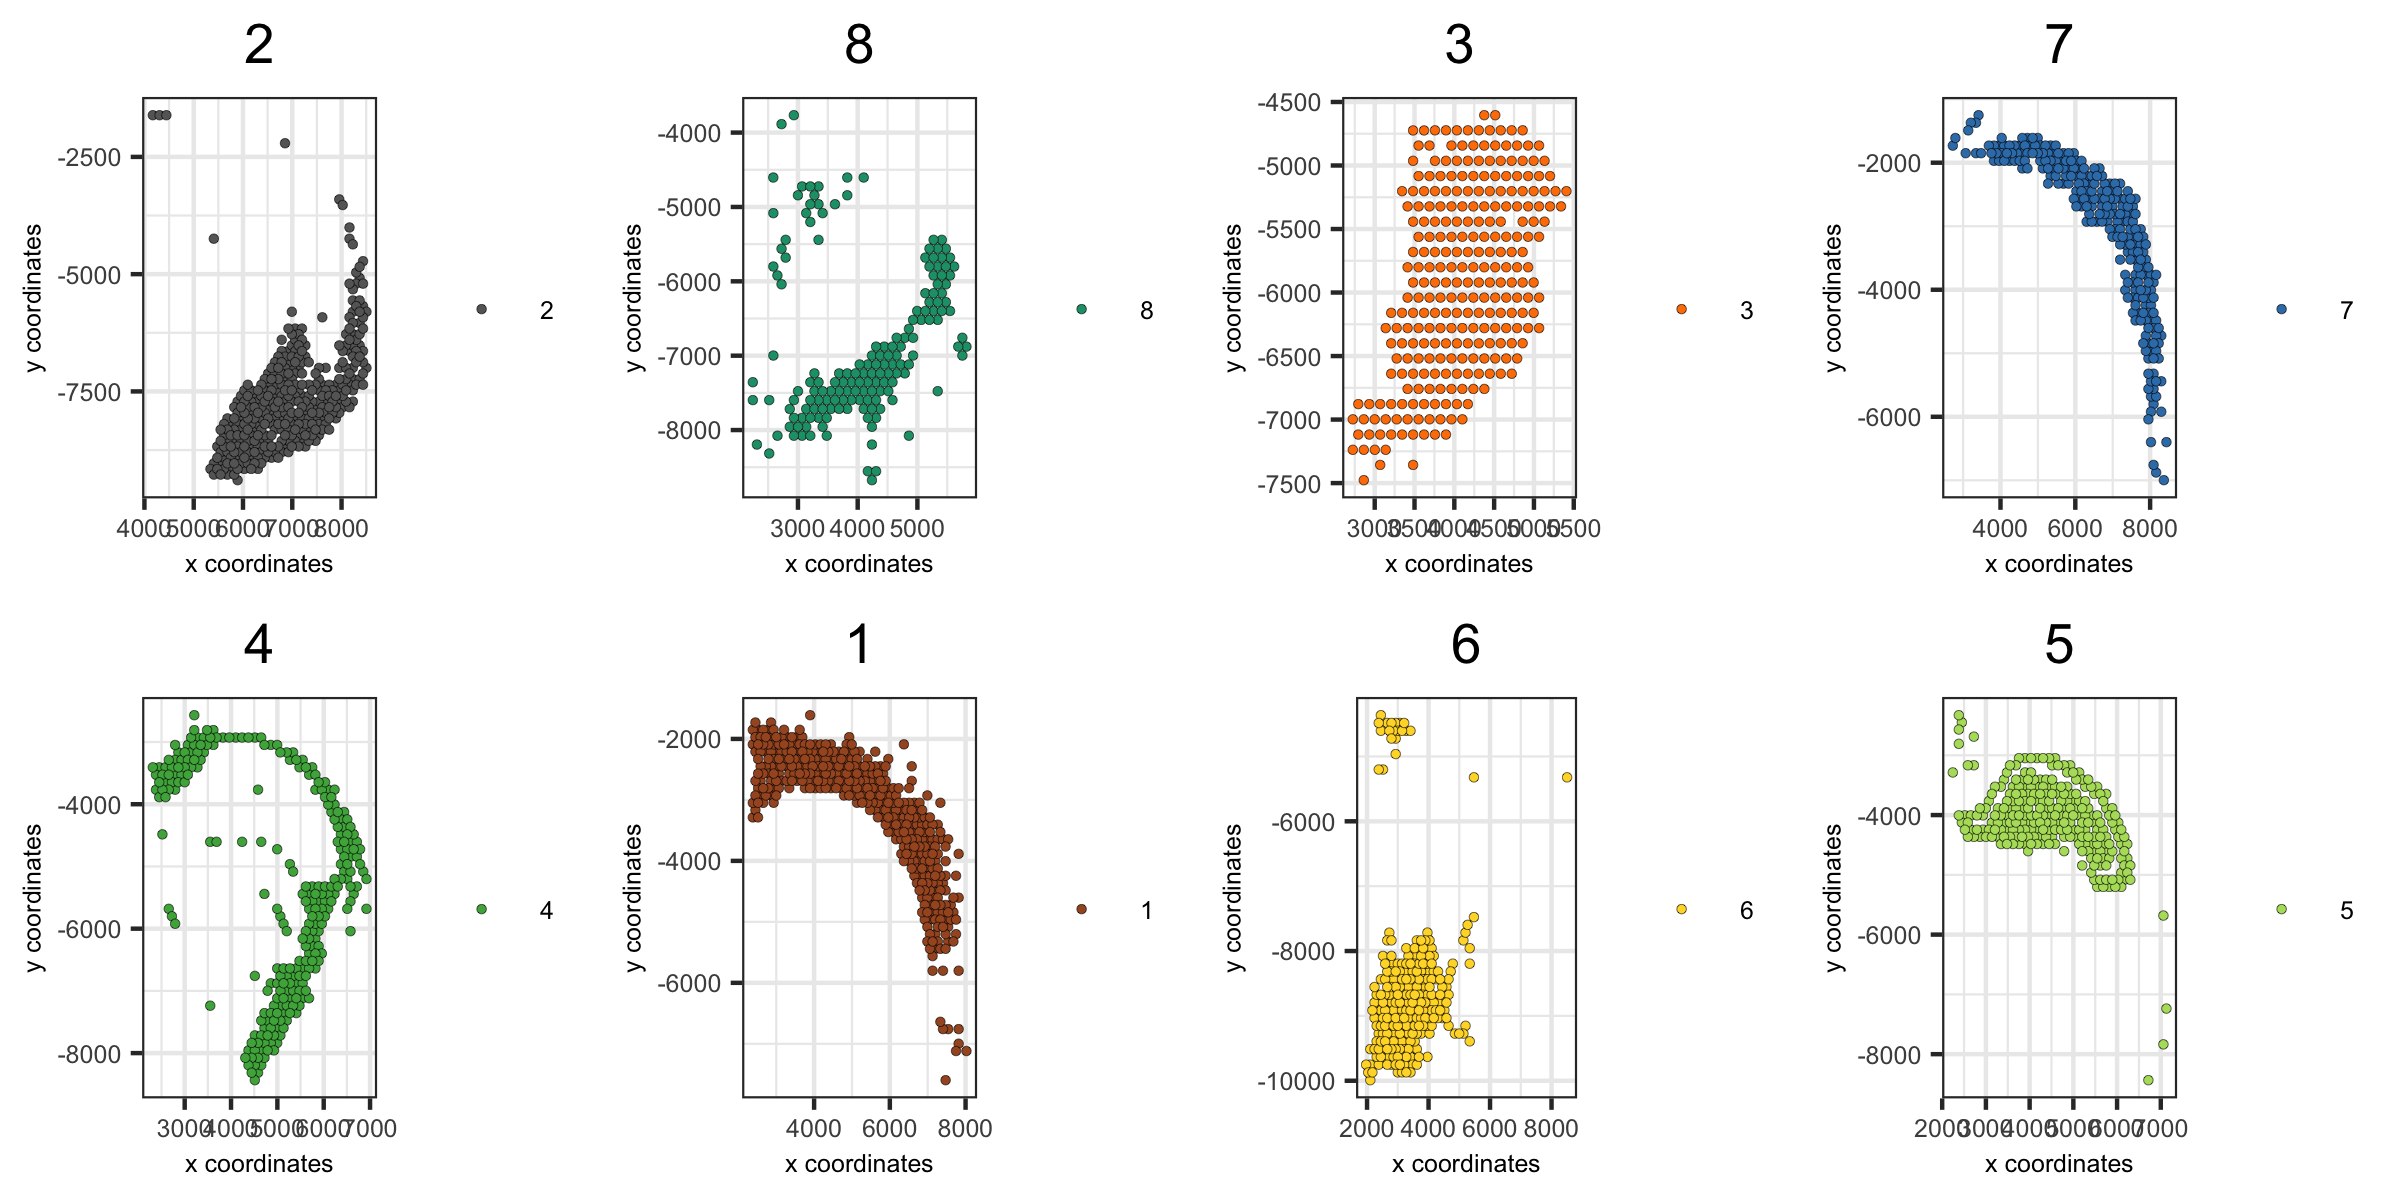
4. Create Spatial Plots
These spatial plots have been grouped by the Leiden Clustering results
spatPlot(visium_brain,
    group_by = 'leiden_clus', group_by_subset = c(1:8),
    cell_color = 'leiden_clus', cow_n_col = 4,
    point_size = 1, axis_text = 6, axis_title = 6, legend_text = 6)
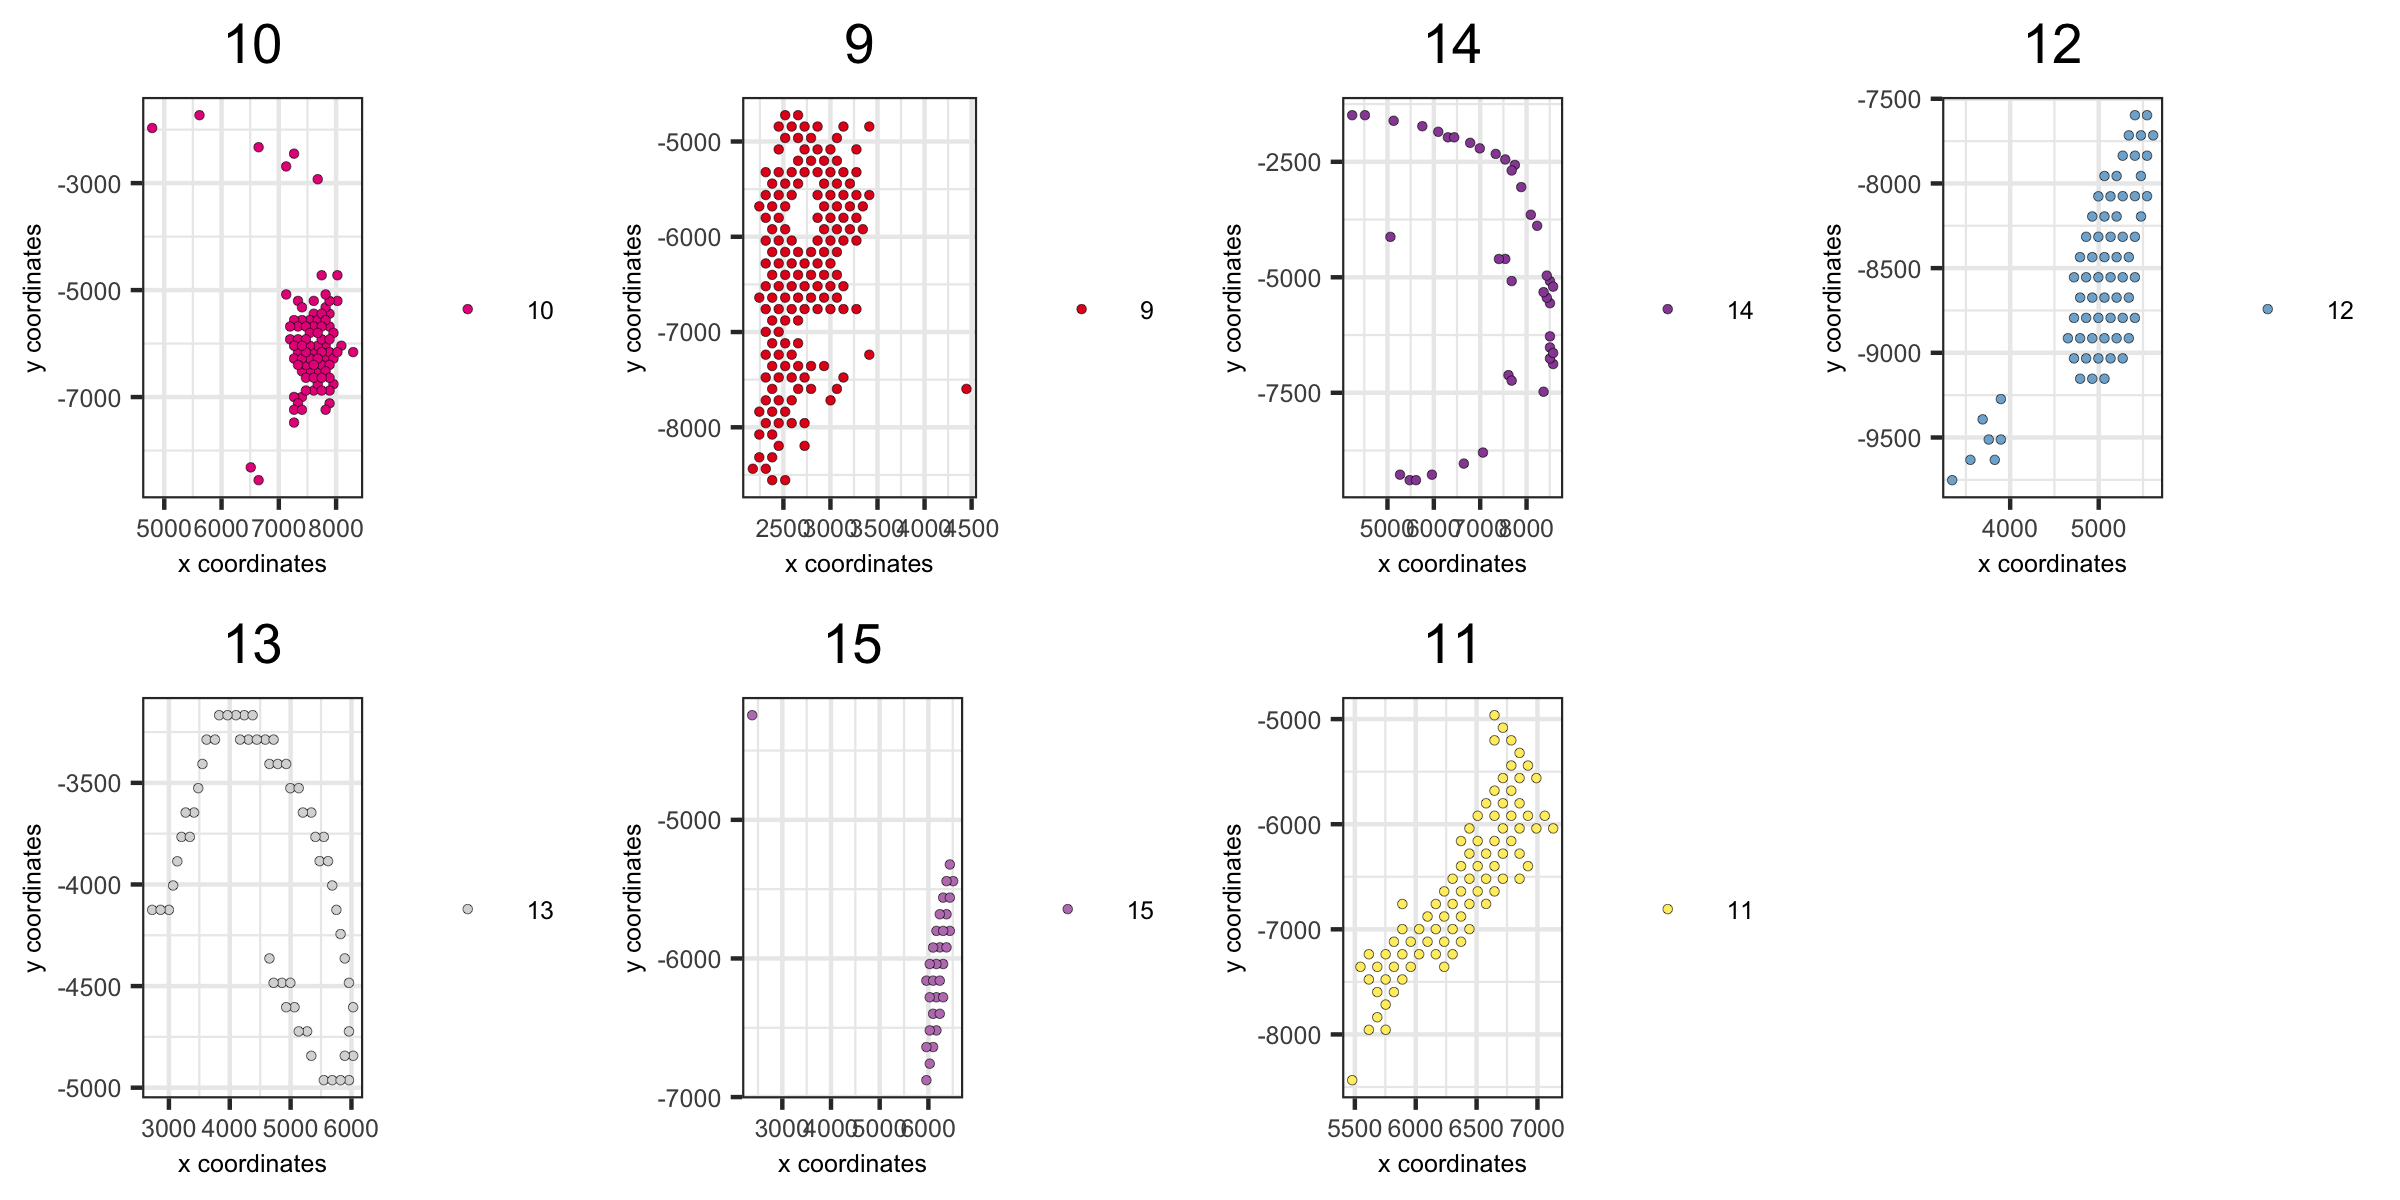
spatPlot(visium_brain,
    group_by = 'leiden_clus', group_by_subset = c(9:16),
    cell_color = 'leiden_clus', cow_n_col = 4,
    point_size = 1, axis_text = 6, axis_title = 6, legend_text = 6)
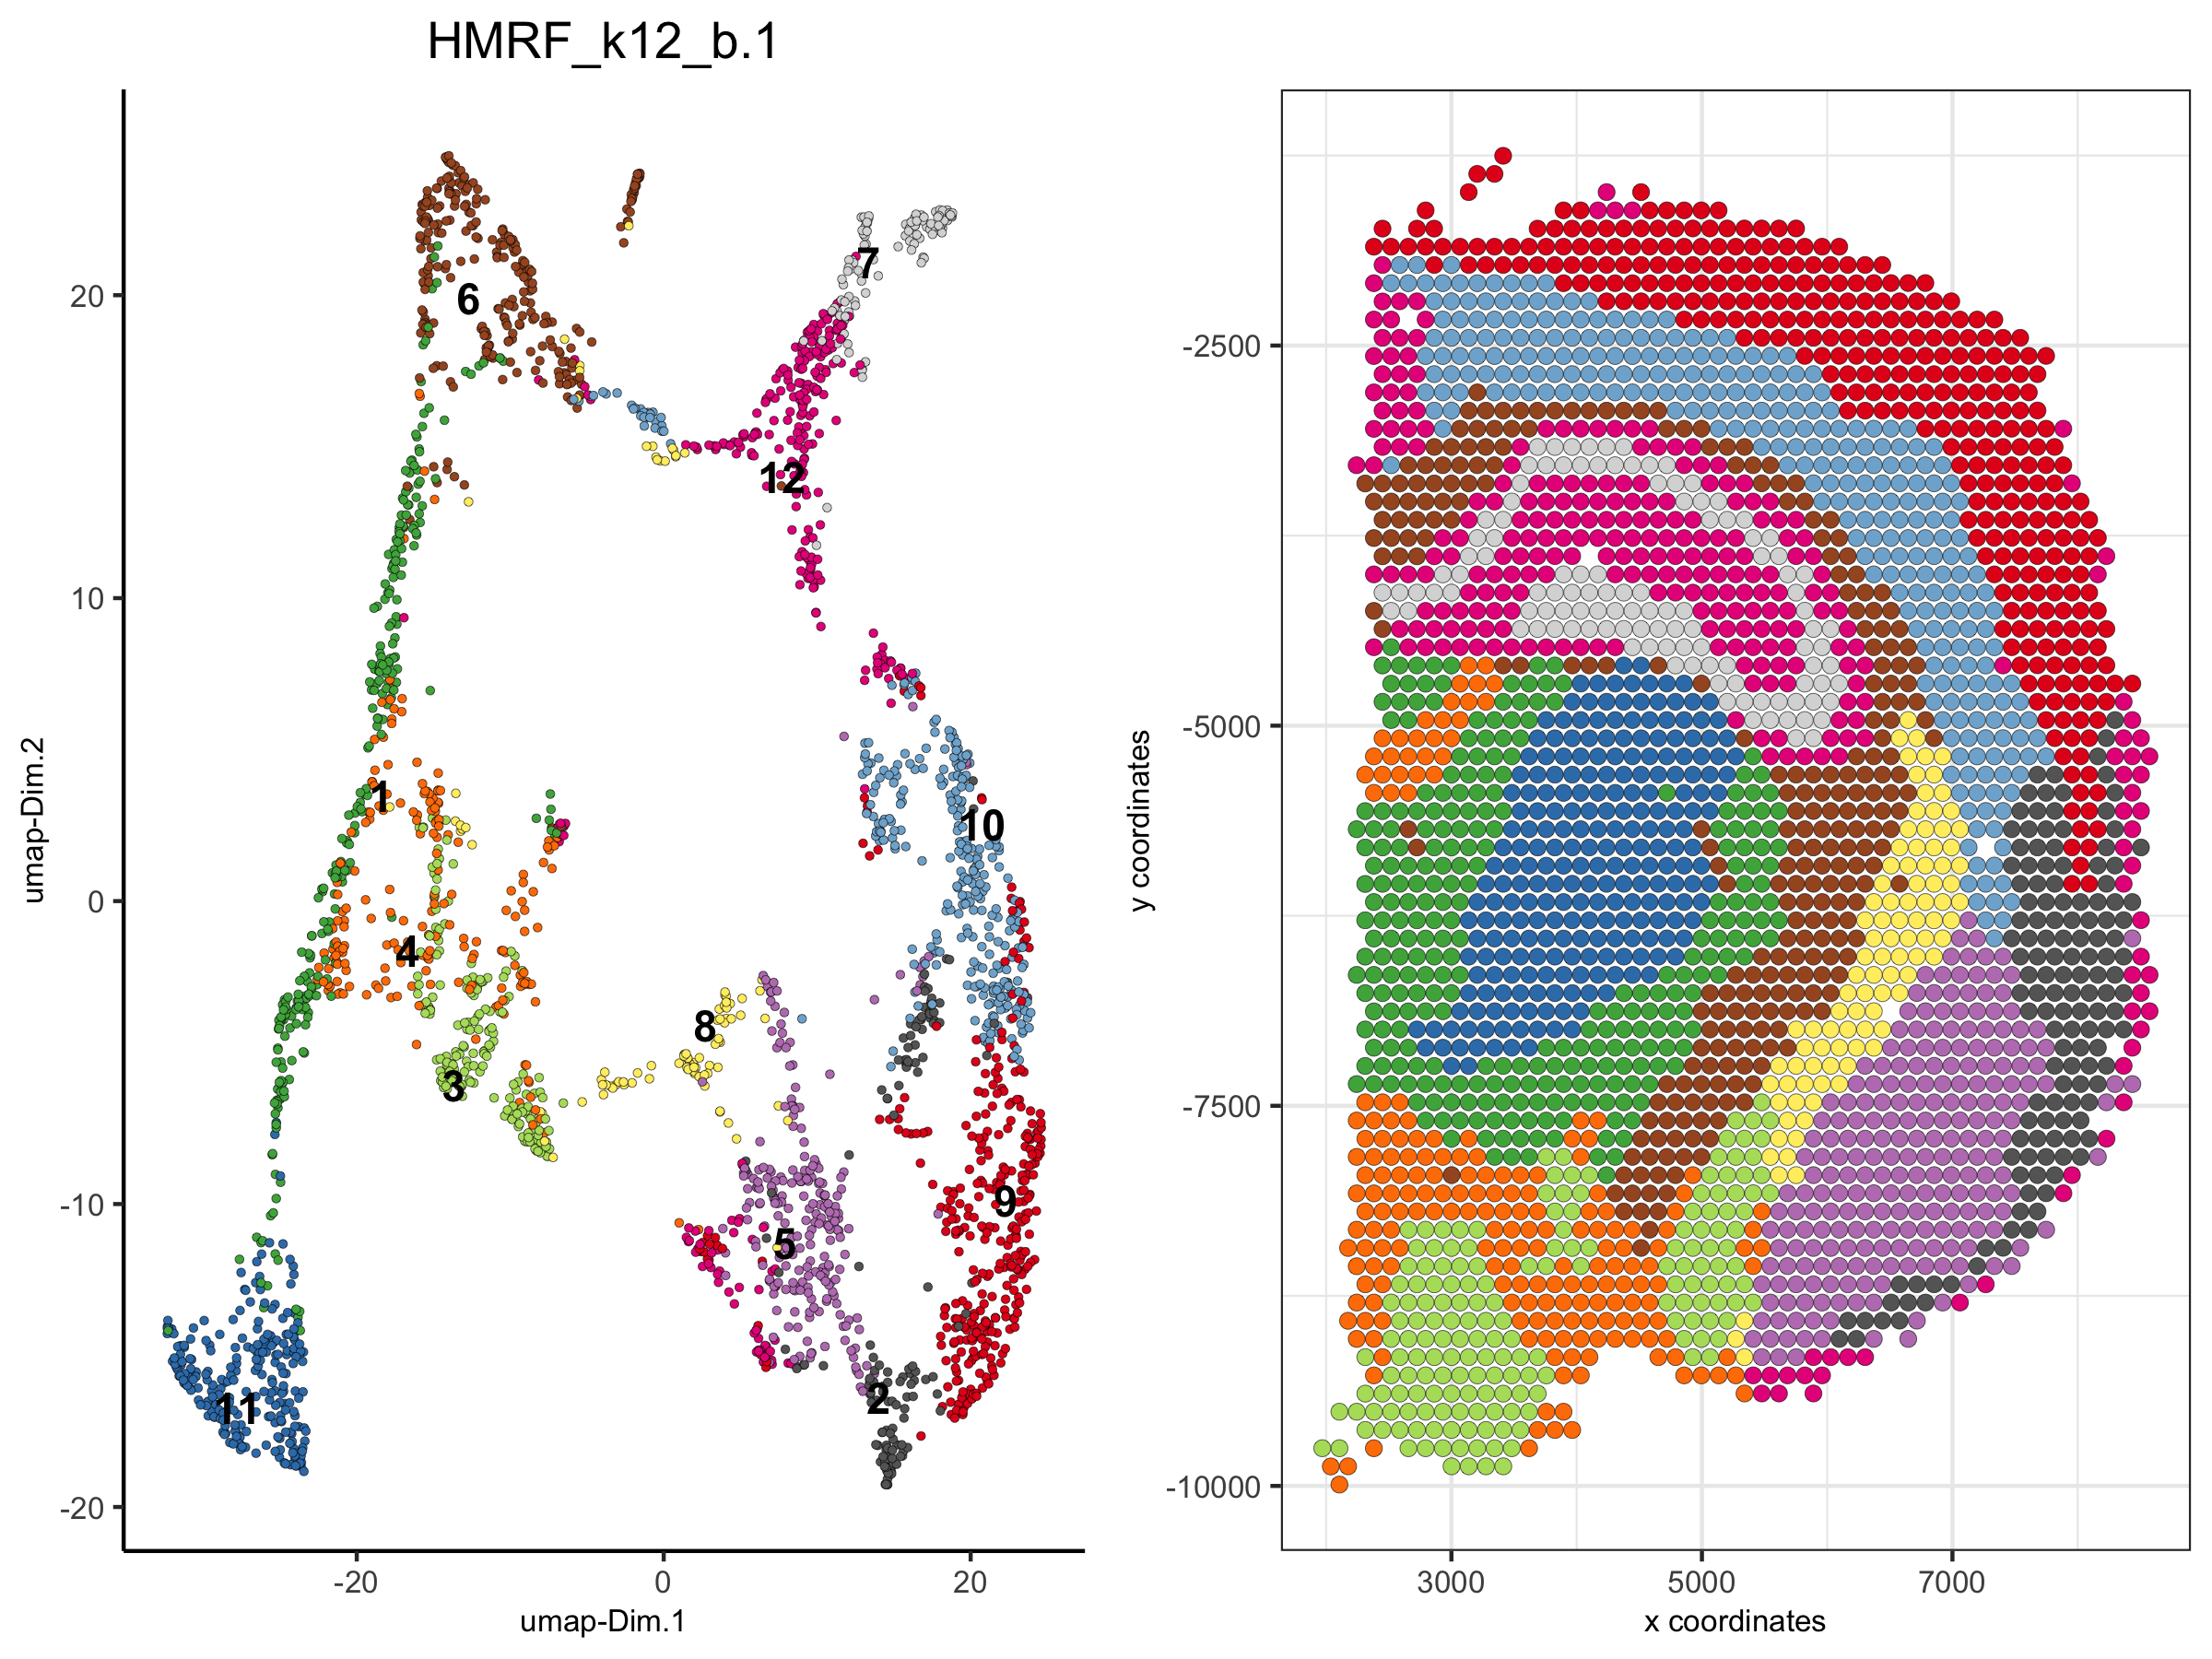
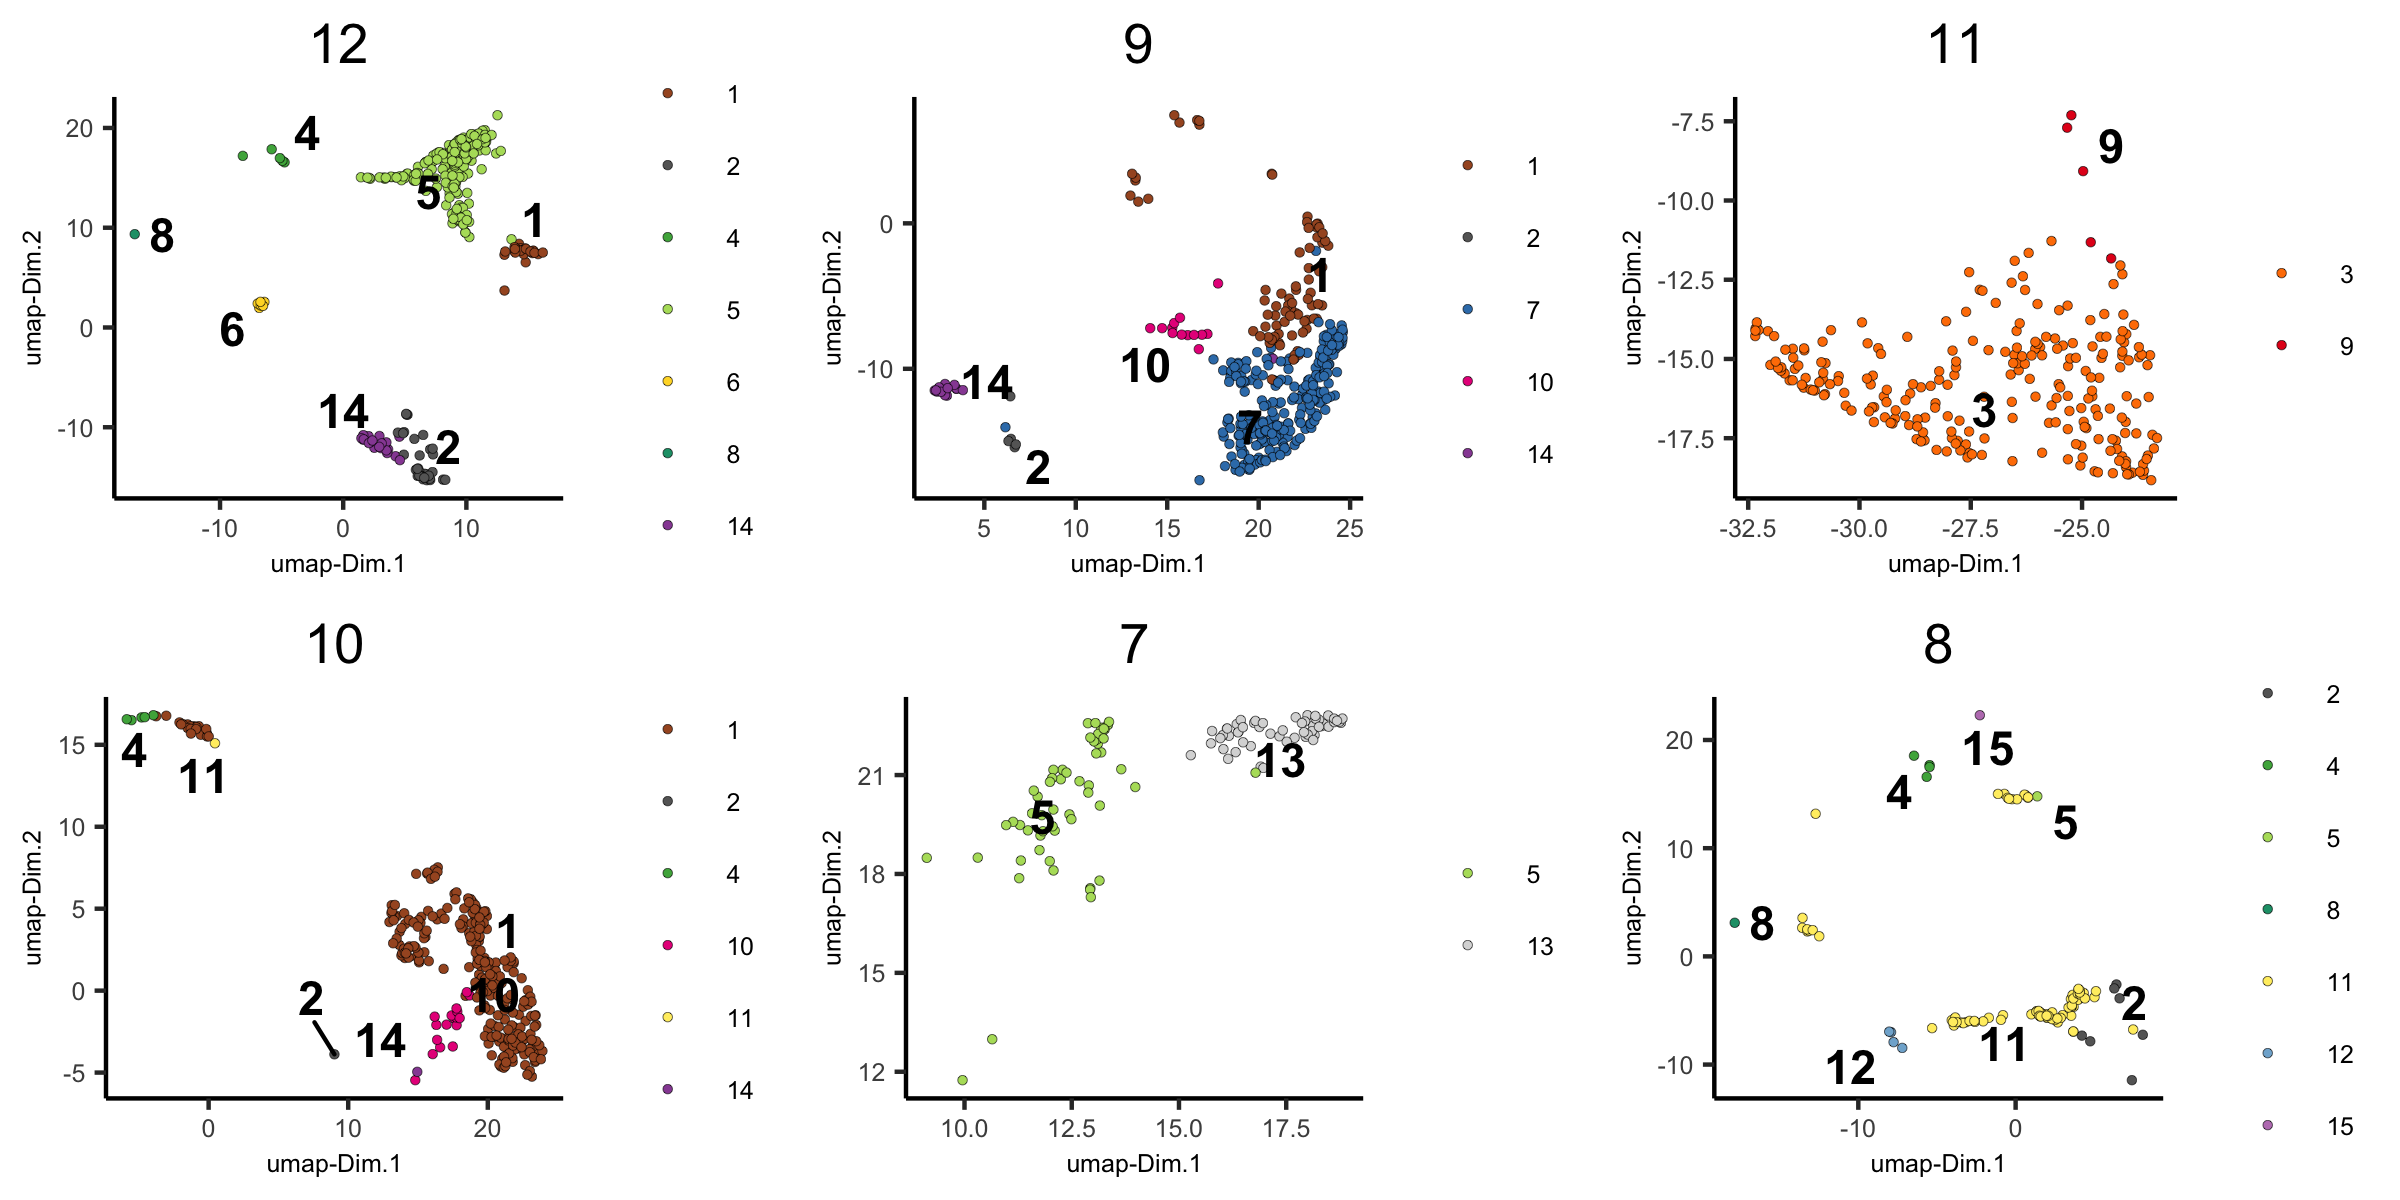
5. Create Dimension Plots
These dimension plots have been grouped by the HMRF results.
spatDimPlot(visium_brain, cell_color = 'HMRF_k12_b.1',
      plot_alignment = 'horizontal', spat_point_size = 2)
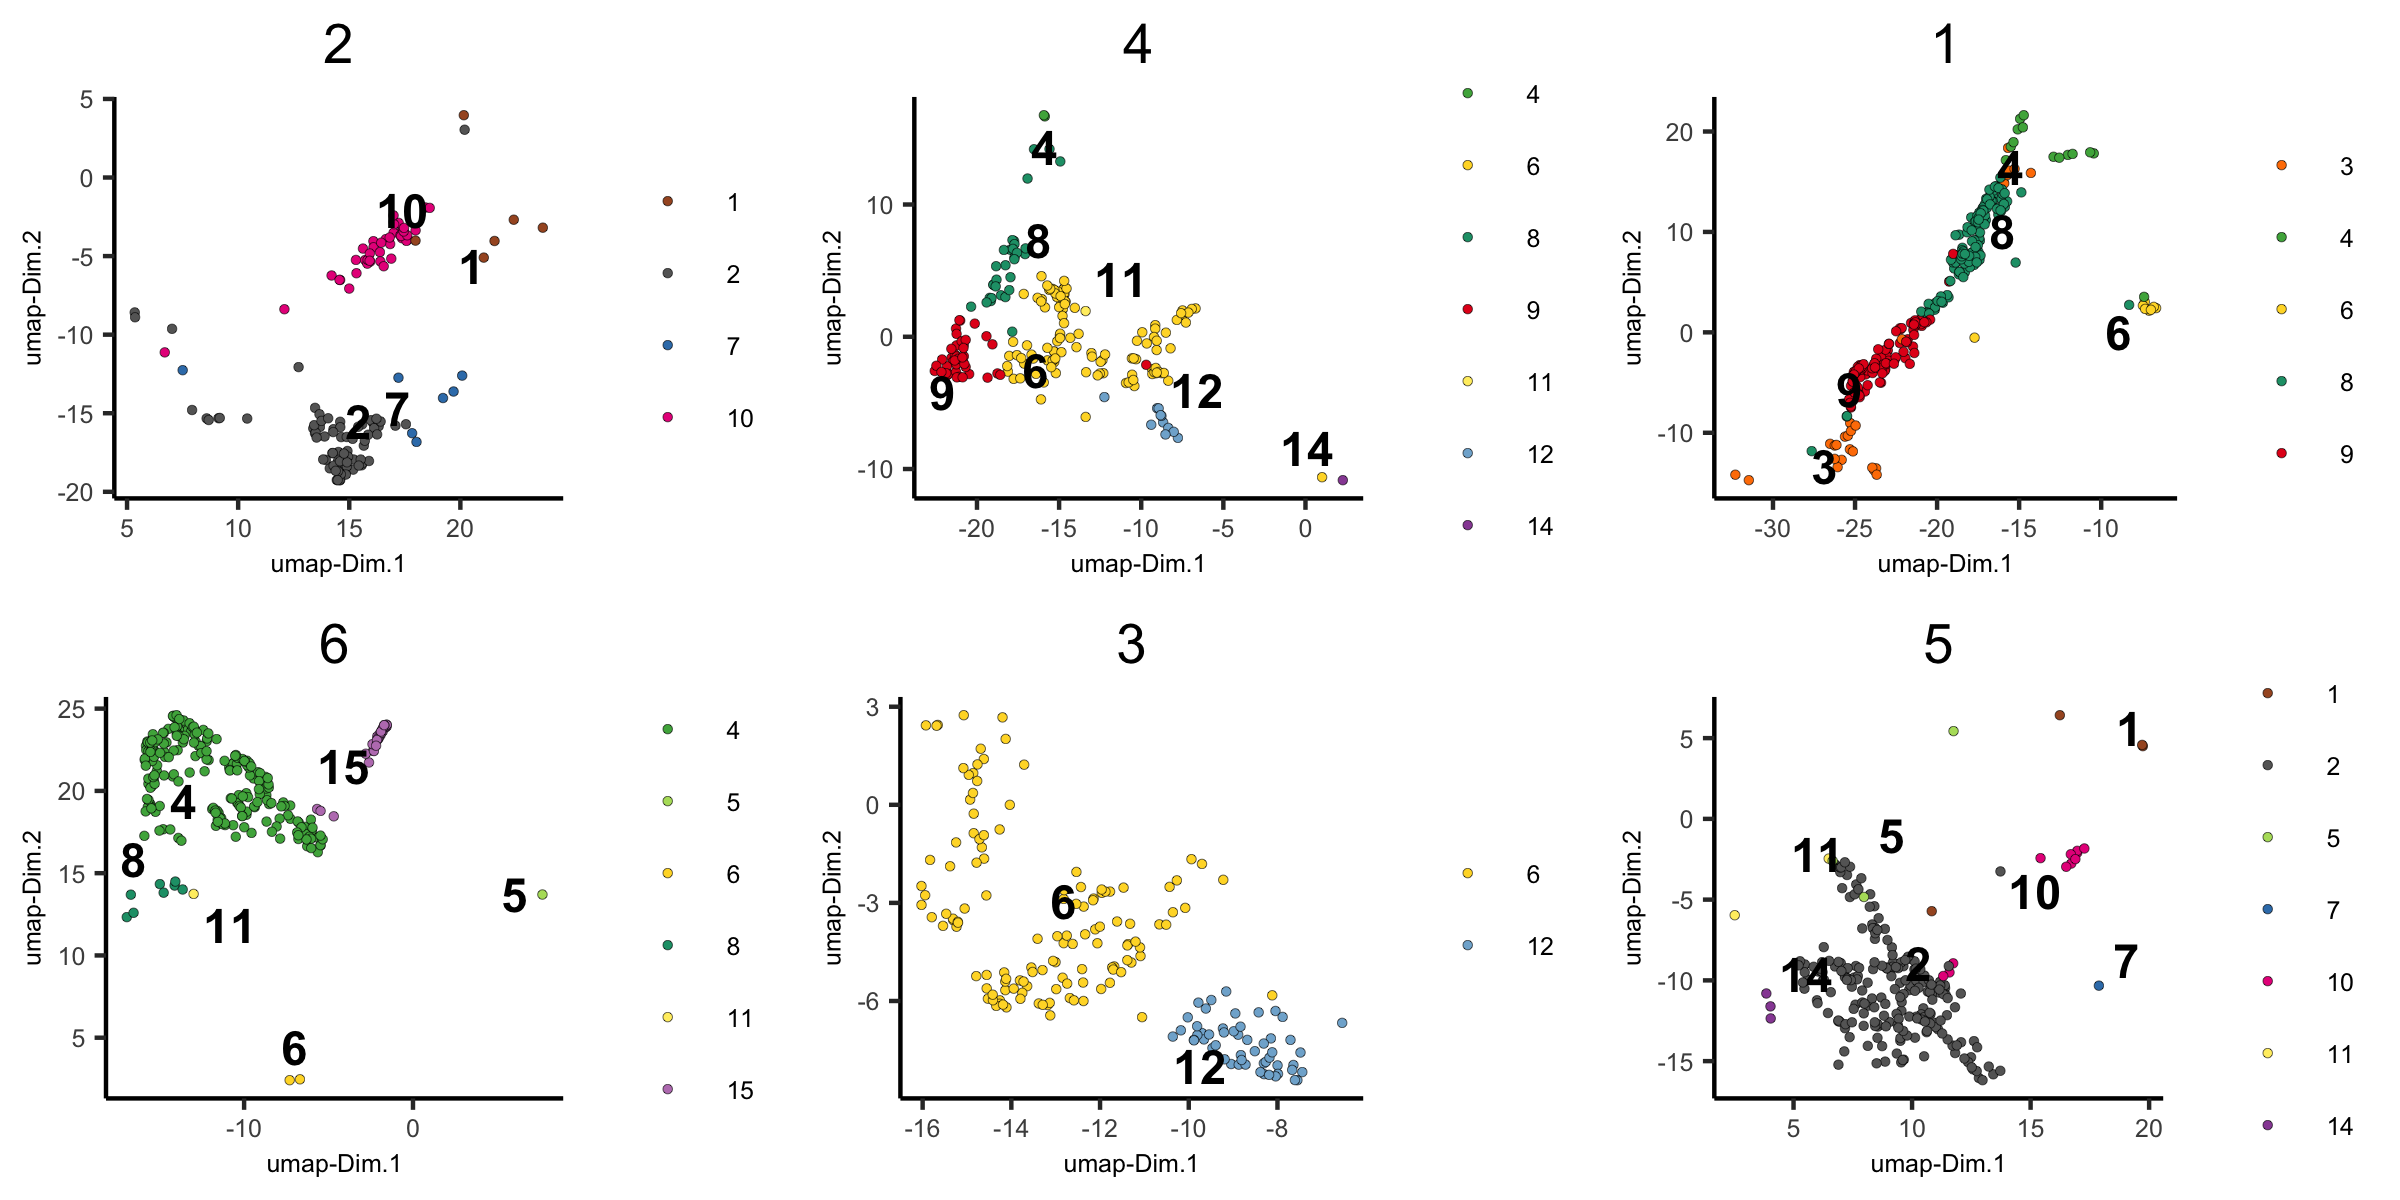
dimPlot(visium_brain,
    group_by = 'HMRF_k12_b.1', group_by_subset = c(1:6),
        cell_color = 'leiden_clus', cow_n_col = 3,
    point_size = 1, axis_text = 6, axis_title = 6, legend_text = 6)
dimPlot(visium_brain,
    group_by = 'HMRF_k12_b.1', group_by_subset = c(7:14),
        cell_color = 'leiden_clus', cow_n_col = 3,
        point_size = 1, axis_text = 6, axis_title = 6, legend_text = 6)
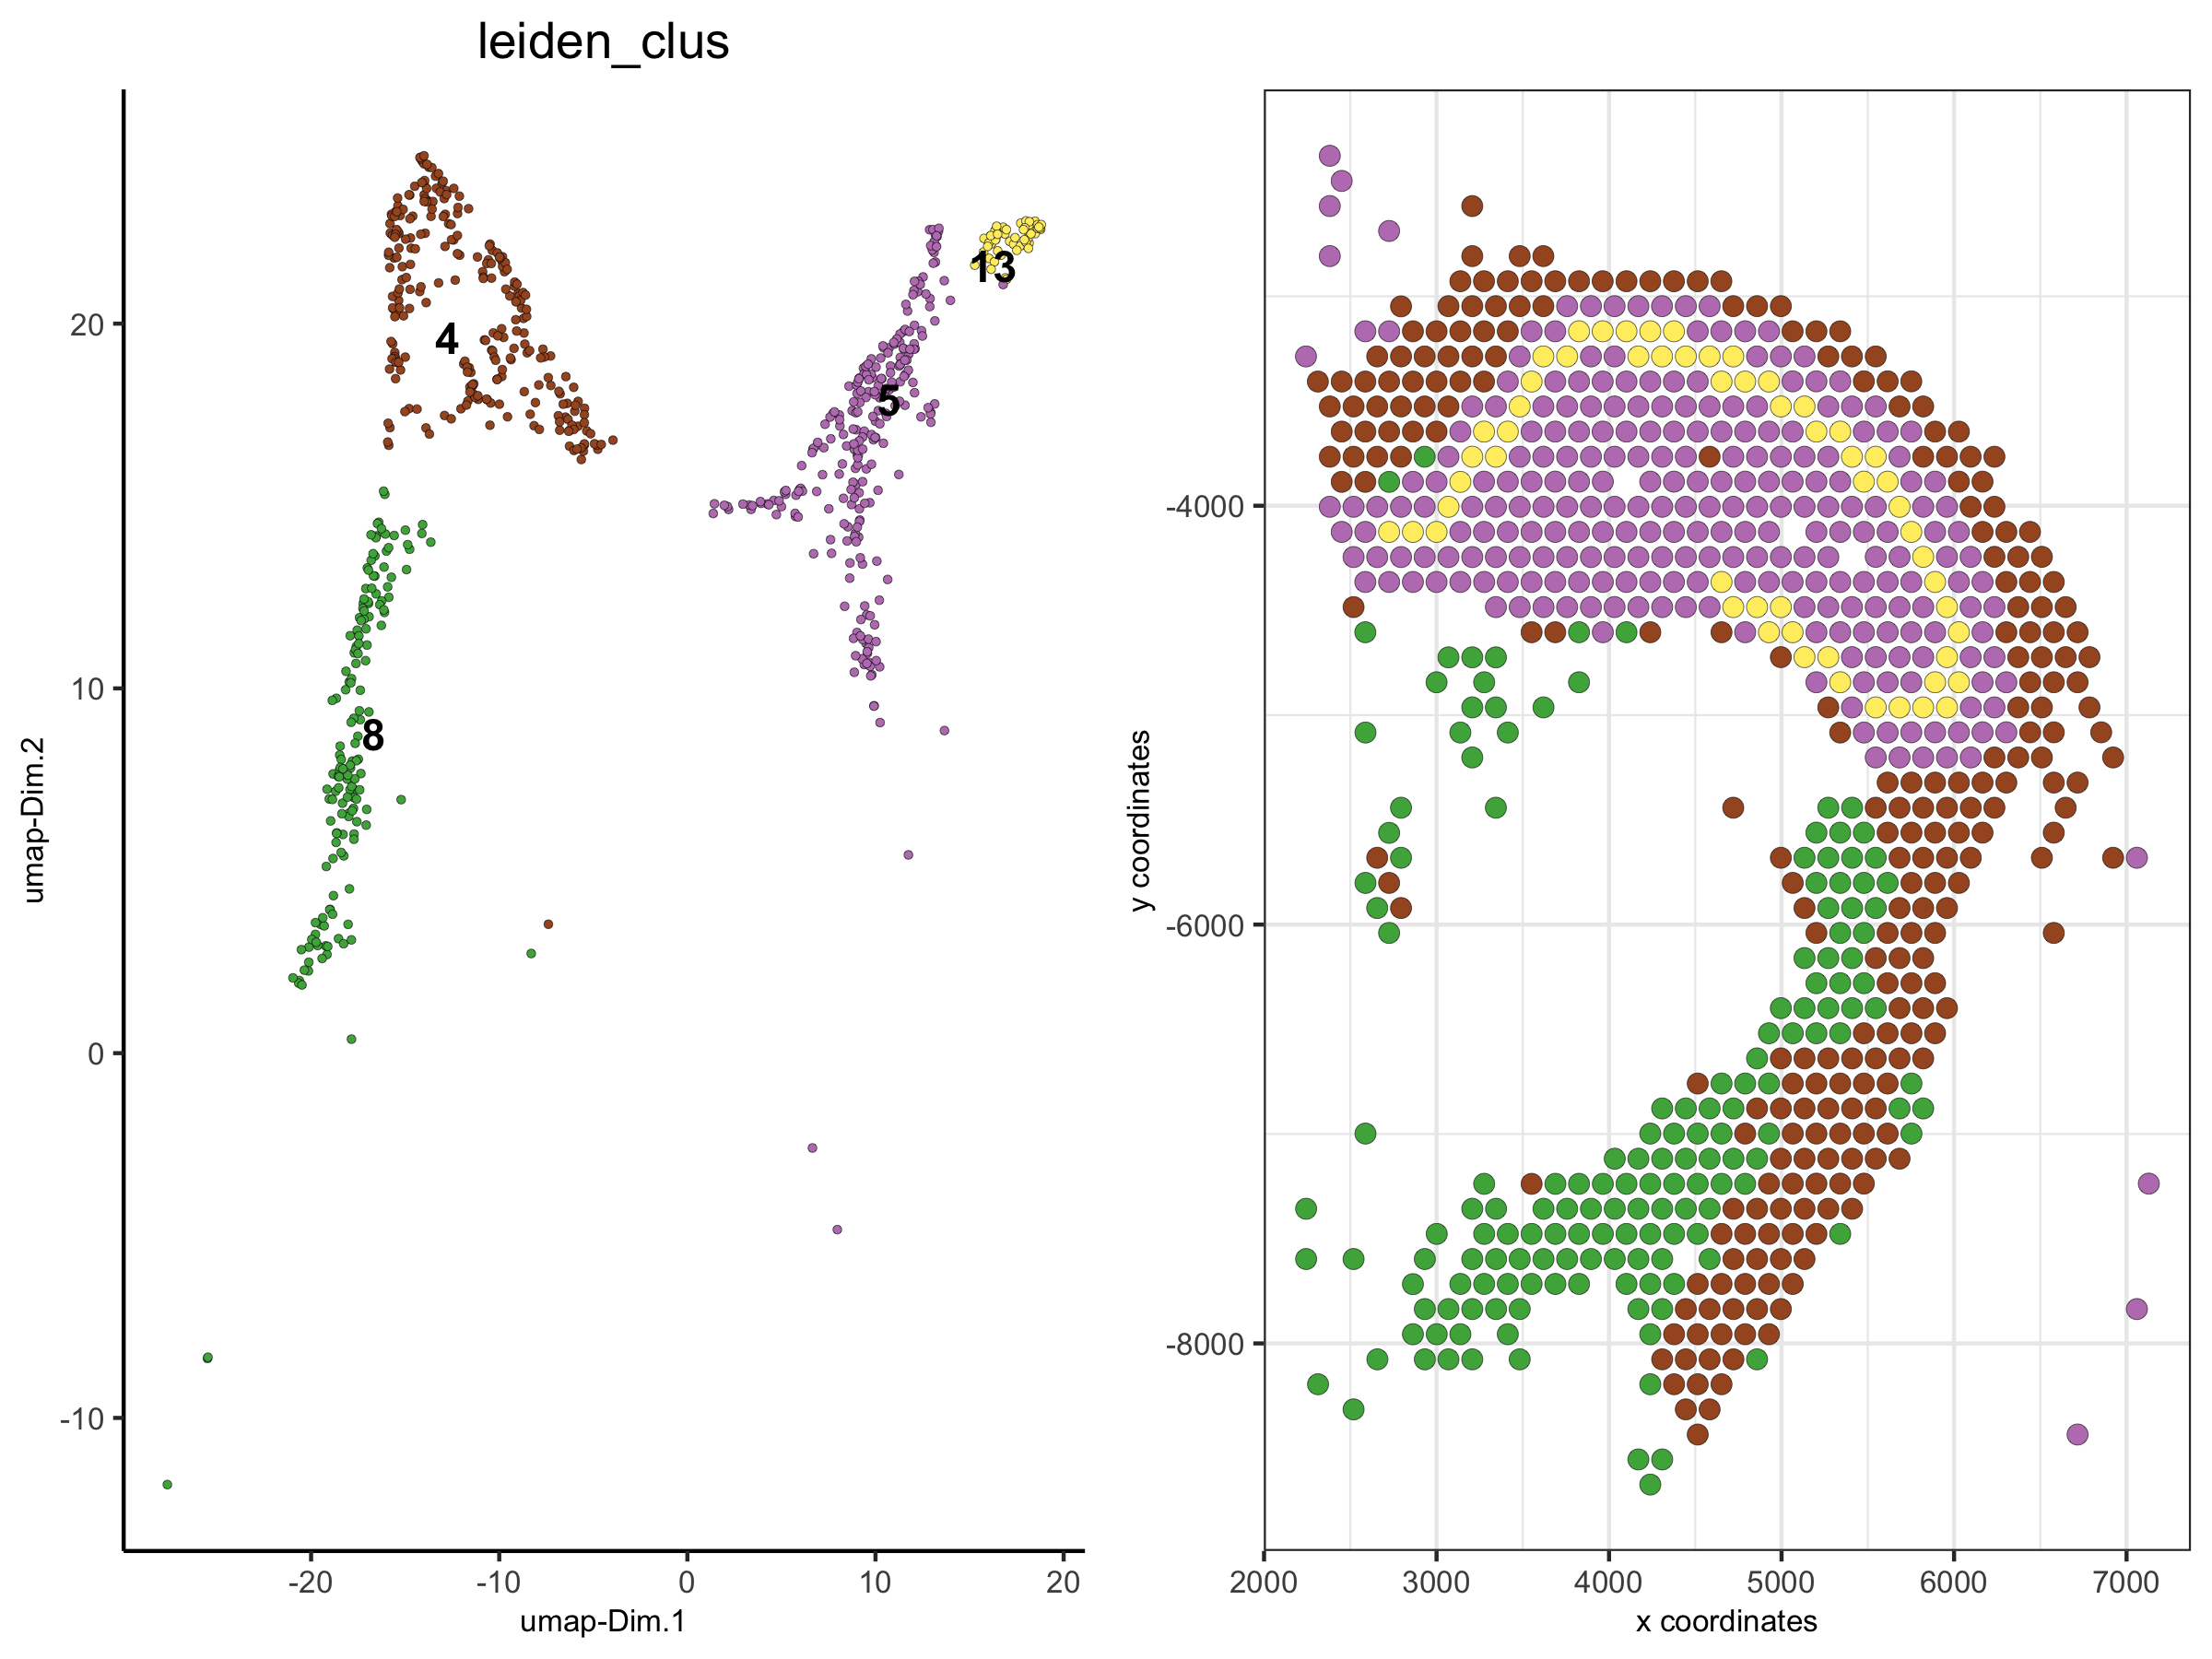
6. Create A New Giotto Object By Subsetting Selected Clusters
metadata = pDataDT(visium_brain)
subset_cell_IDs = metadata[leiden_clus %in% c(4, 5, 8, 13)]$cell_ID
visium_brain_small = subsetGiotto(visium_brain, cell_ids = subset_cell_IDs)

spatDimPlot(visium_brain_small,
     cell_color = 'leiden_clus',
     plot_alignment = 'horizontal', spat_point_size = 2.5)
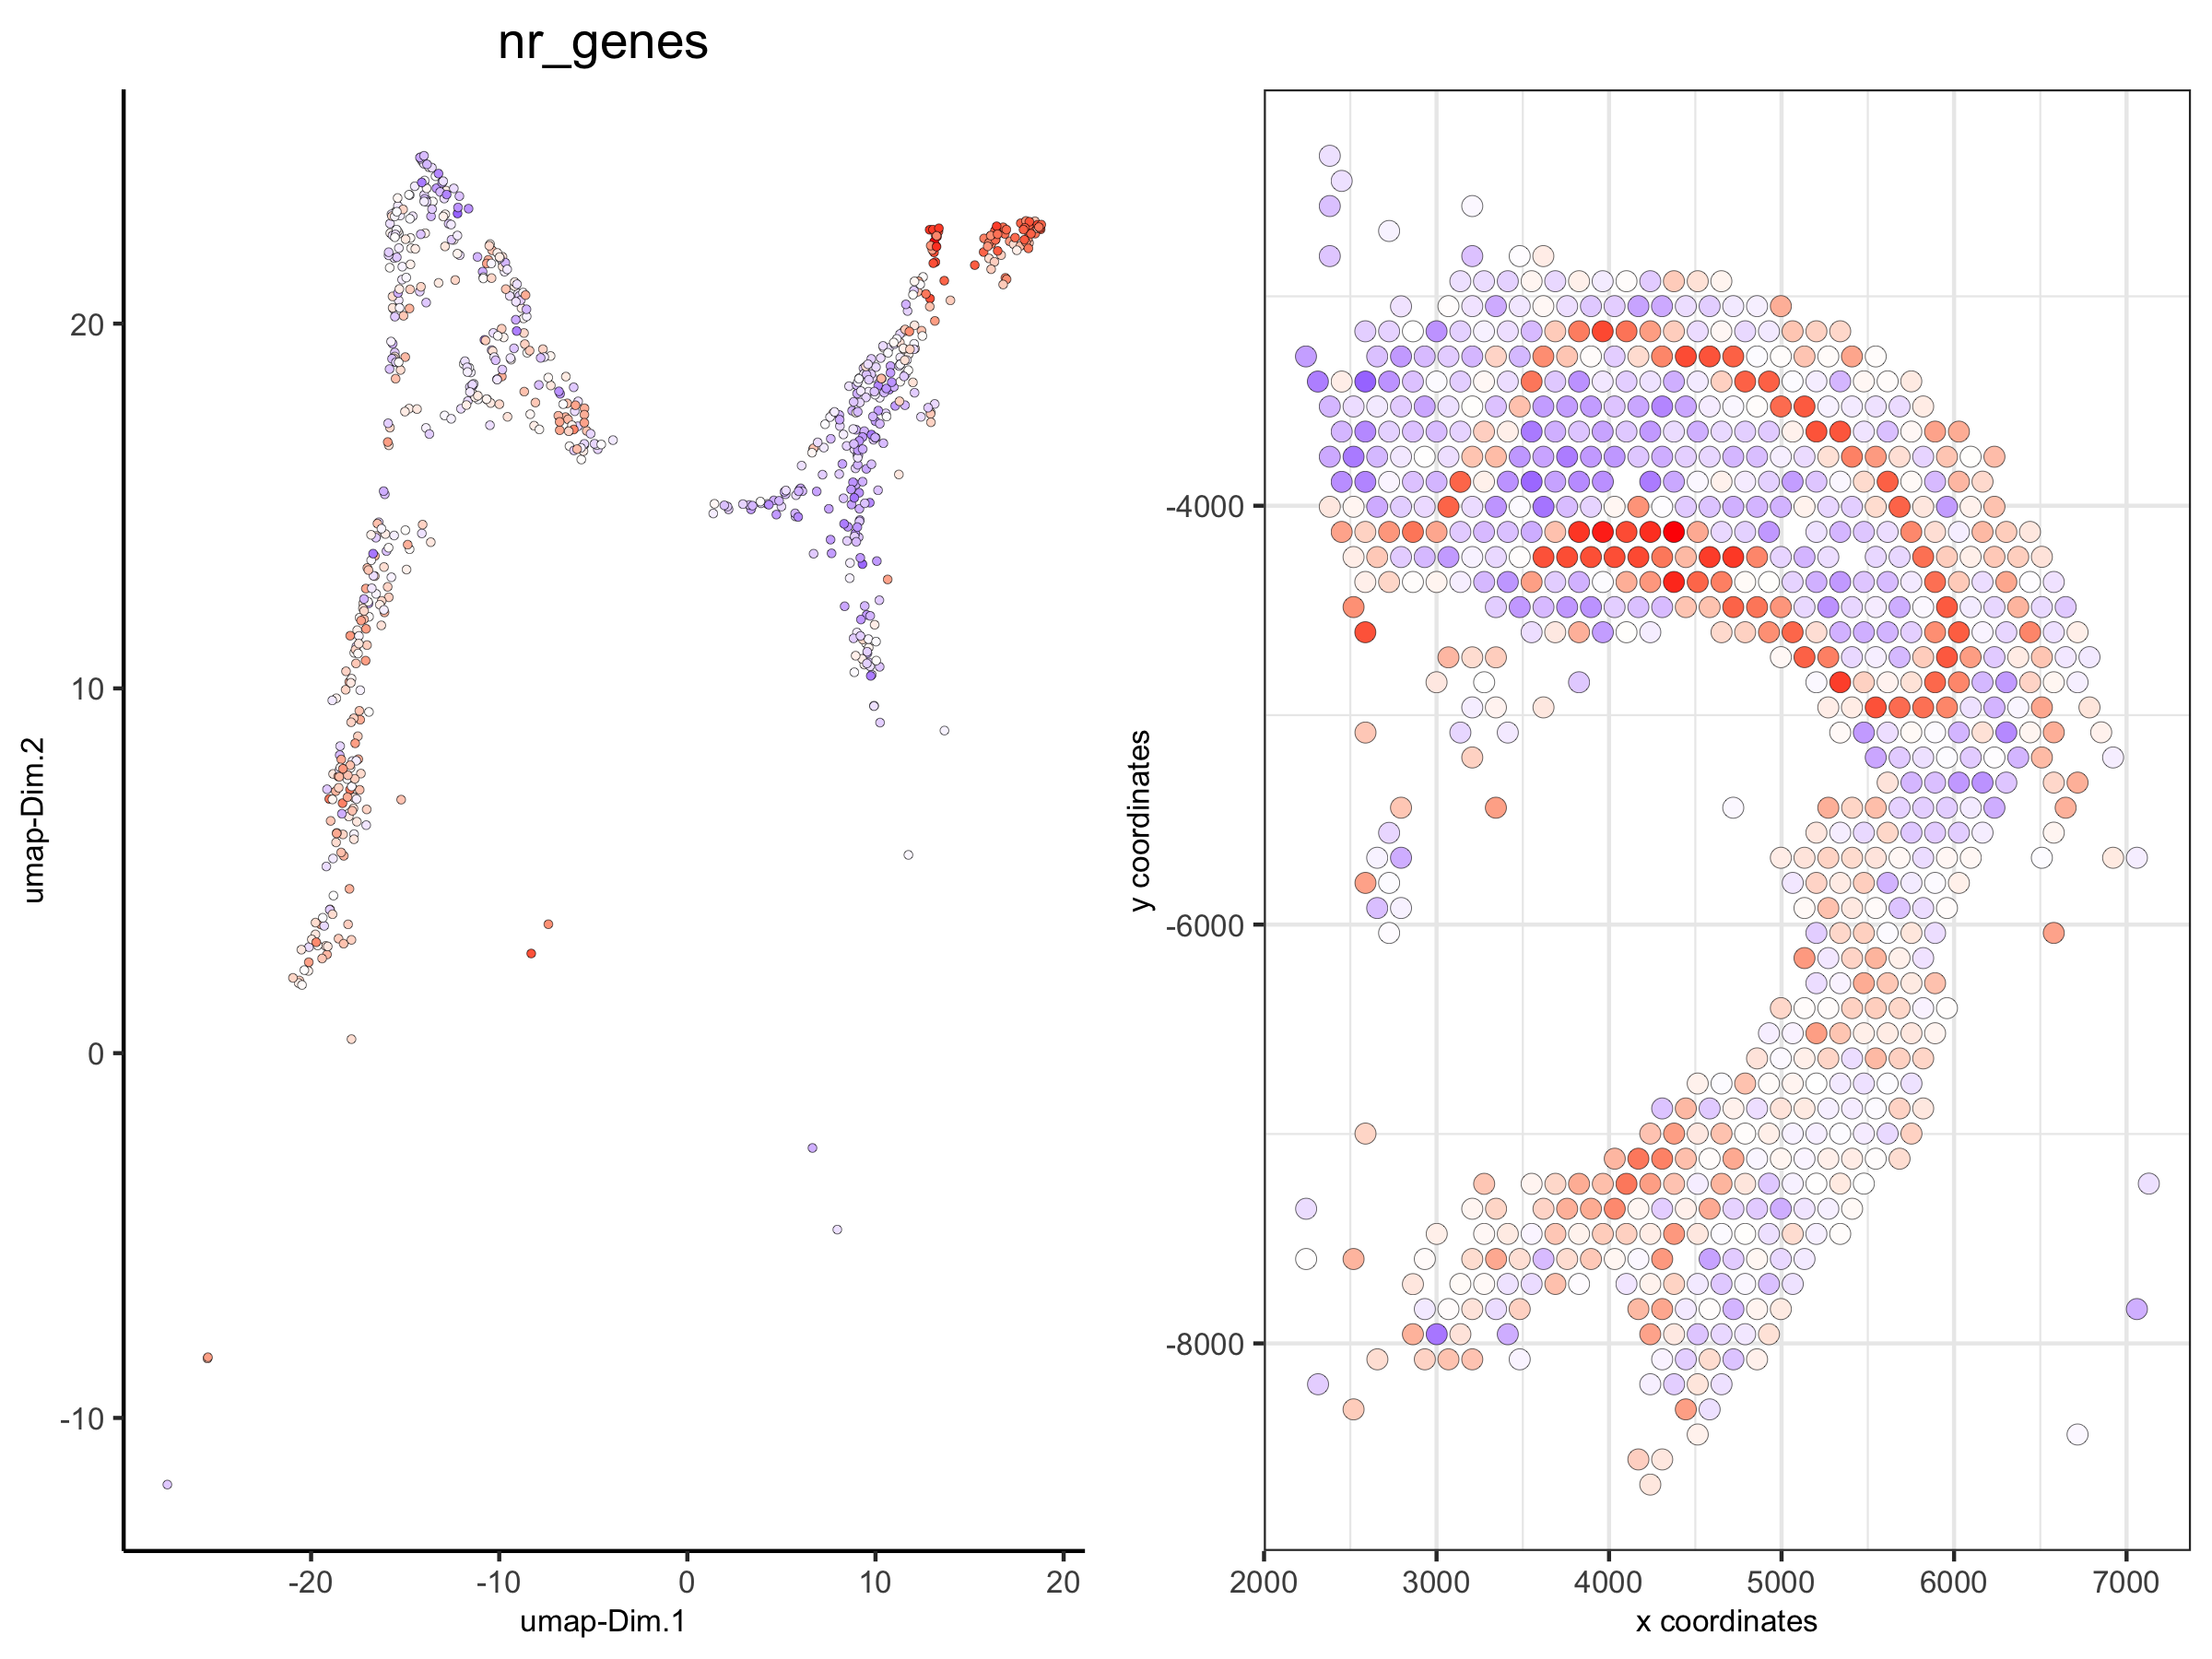
spatDimPlot(visium_brain_small,
     cell_color = 'nr_genes', color_as_factor = F,
     plot_alignment = 'horizontal', spat_point_size = 2.5)
7. Create A New Giotto Object By Subsetting Spatial Coordinates/Locations
DG_subset = subsetGiottoLocs(visium_brain,
             x_max = 6500, x_min = 3000,
             y_max = -2500, y_min = -5500)

spatDimPlot(DG_subset,
    cell_color = 'leiden_clus',
    plot_alignment = 'horizontal', spat_point_size = 4,
    save_param = list(save_name = '6_DG_loc_subset', base_height = 4))